
- Home >
- Stock Photos >
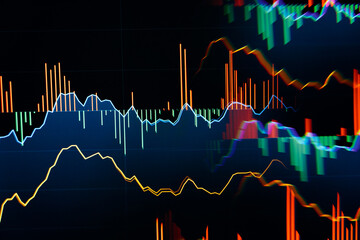
- Digital Financial Market Data Visualization
Digital Financial Market Data Visualization Image

Complex sharp visualization reflecting dynamic financial trends with global context. Highlights key performance indicators through color-coded numbers, suitable for illustrating articles related to global stock markets, investment strategies, or economic forecasts. Valuable for investors and analysts seeking to visualize daily movements in financial markets technologies worldwide.
Powered by 


downloads
Tags:
More
Credit Photo
If you would like to credit the Photo, here are some ways you can do so
Text Link
photo Link
<span class="text-link">
<span>
<a target="_blank" href=https://pikwizard.com/photo/digital-financial-market-data-visualization/787d49d324ba4689d58124c3e7f972cc/>PikWizard</a>
</span>
</span>
<span class="image-link">
<span
style="margin: 0 0 20px 0; display: inline-block; vertical-align: middle; width: 100%;"
>
<a
target="_blank"
href="https://pikwizard.com/photo/digital-financial-market-data-visualization/787d49d324ba4689d58124c3e7f972cc/"
style="text-decoration: none; font-size: 10px; margin: 0;"
>
<img src="https://pikwizard.com/pw/medium/787d49d324ba4689d58124c3e7f972cc.jpg" style="margin: 0; width: 100%;" alt="" />
<p style="font-size: 12px; margin: 0;">PikWizard</p>
</a>
</span>
</span>
Free (free of charge)
Free for personal and commercial use.
Author: Creative Art
Similar Free Stock Images

Premium


Premium


Premium


Premium


Premium


Premium


Premium

Premium

Premium


Premium


Premium


Premium


Premium


Premium


Premium

Premium

Premium


Premium


Premium


Premium


Premium


Premium


Premium


Premium


Premium


Explore More Free Stock Images