- Home >
- Stock Photos >
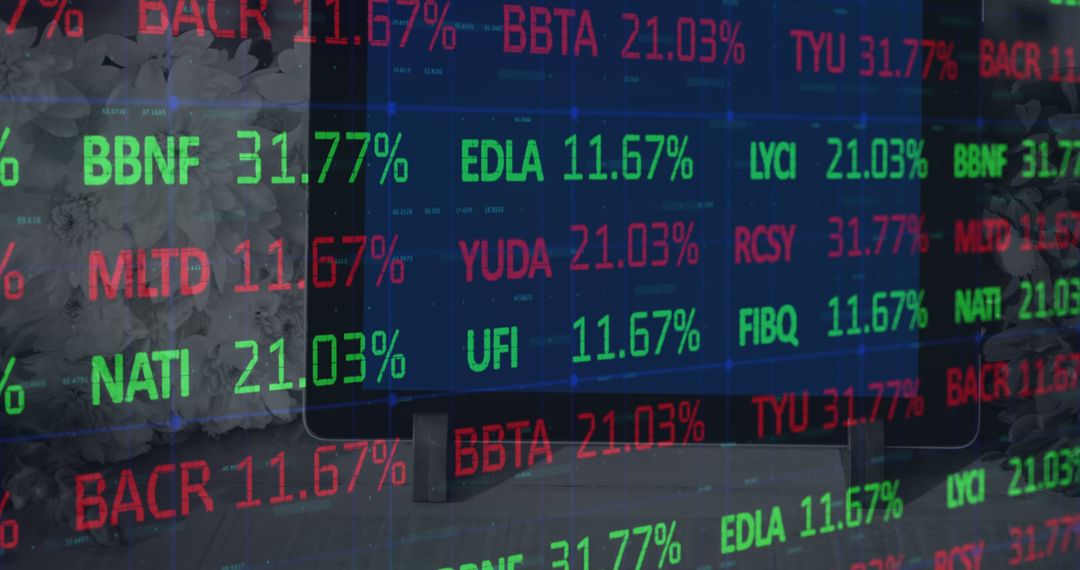
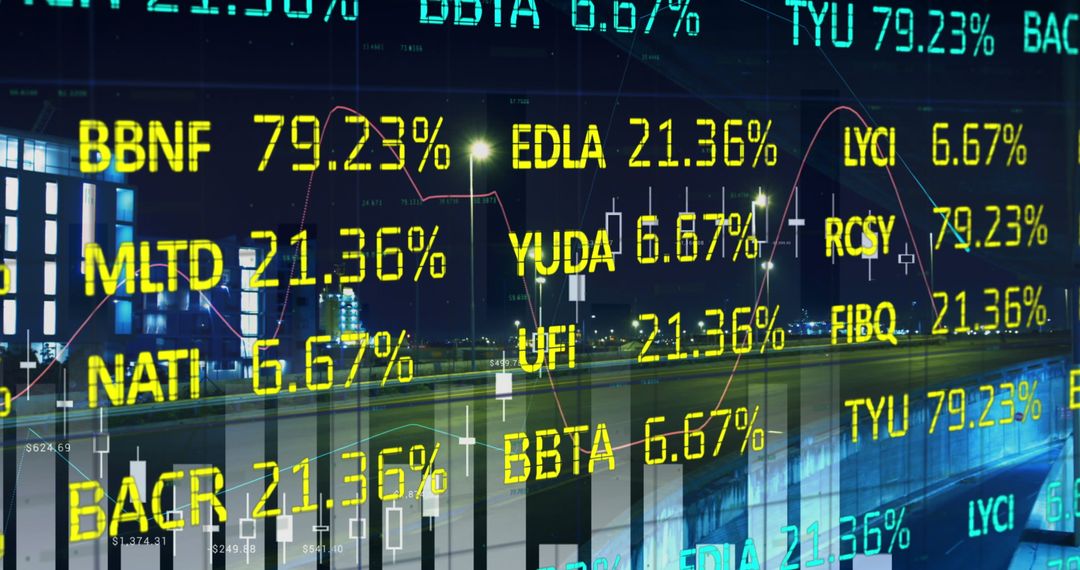
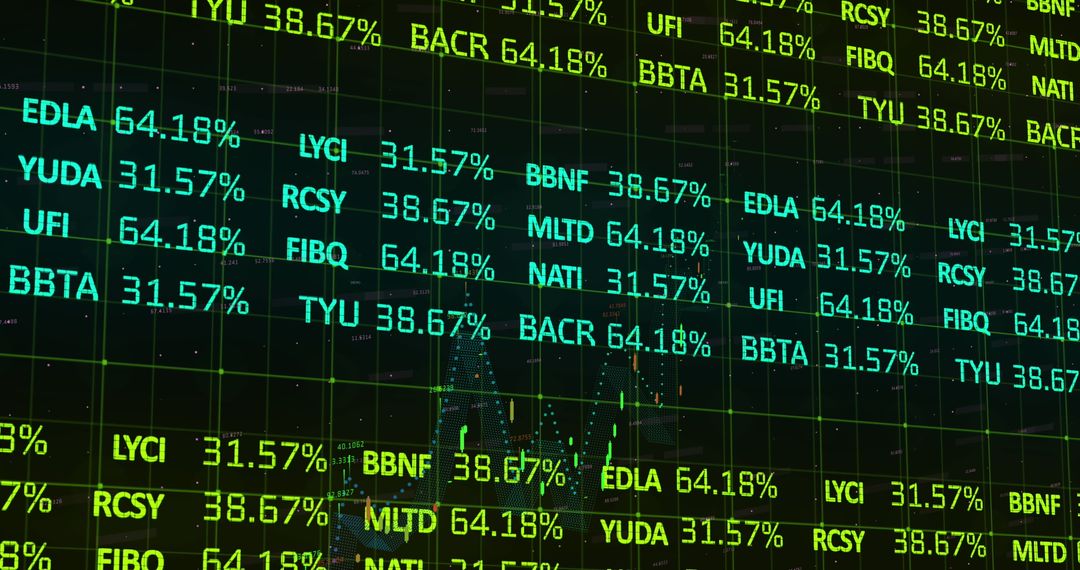
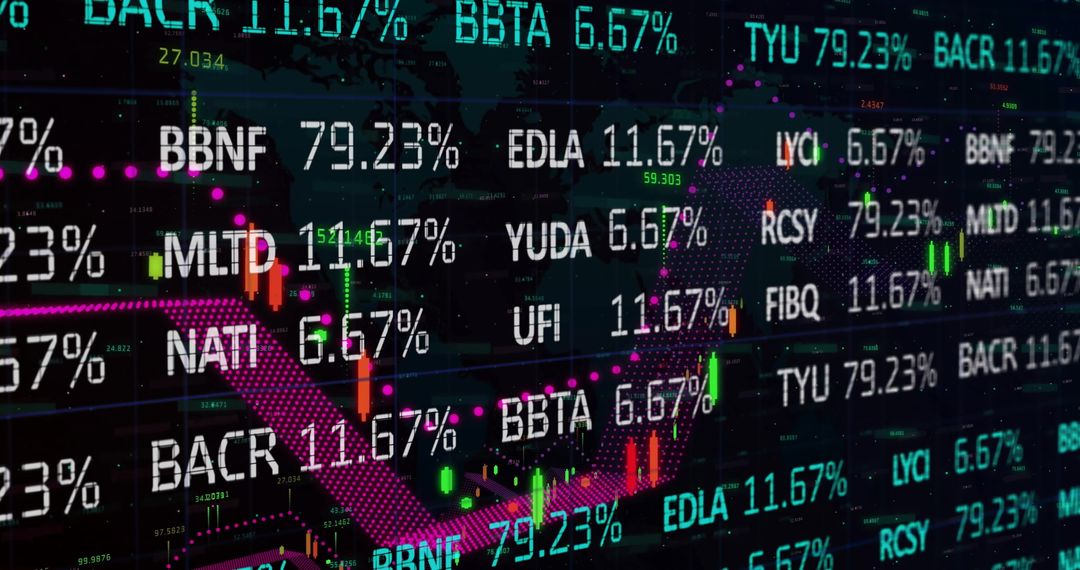
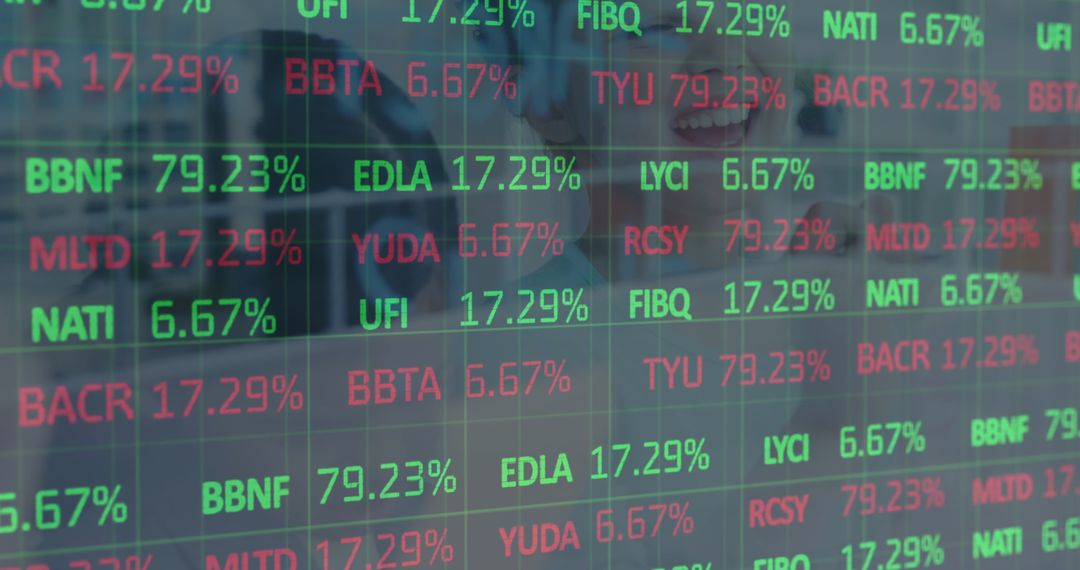
- Digital Financial Market Display with Data Metrics Overlay
Digital Financial Market Display with Data Metrics Overlay Image

Green and red numbers show fluctuating financial metrics symbolizing stock market activity possibly linked to trading results. Concept represents the global reach of financial markets and data assessment suitable for editorial content, economic publications, investment presentations, or tech-driven analyses featuring modern trading concepts. Ideal for exemplifying digital financial market mechanics or encoding practices.
Powered by 


8
downloads
downloads
Tags:
More
Credit Photo
If you would like to credit the Photo, here are some ways you can do so
Text Link
photo Link
<span class="text-link">
<span>
<a target="_blank" href=https://pikwizard.com/photo/digital-financial-market-display-with-data-metrics-overlay/8ccc0fa071e5841d421ff62cf202446d/>PikWizard</a>
</span>
</span>
<span class="image-link">
<span
style="margin: 0 0 20px 0; display: inline-block; vertical-align: middle; width: 100%;"
>
<a
target="_blank"
href="https://pikwizard.com/photo/digital-financial-market-display-with-data-metrics-overlay/8ccc0fa071e5841d421ff62cf202446d/"
style="text-decoration: none; font-size: 10px; margin: 0;"
>
<img src="https://pikwizard.com/pw/medium/8ccc0fa071e5841d421ff62cf202446d.jpg" style="margin: 0; width: 100%;" alt="" />
<p style="font-size: 12px; margin: 0;">PikWizard</p>
</a>
</span>
</span>
Free (free of charge)
Free for personal and commercial use.
Author: Authentic Images
Similar Free Stock Images

Premium


Premium


Premium


Premium


Premium


Premium


Premium


Premium


Premium


Premium


Premium


Premium


Premium


Premium


Premium


Premium


Premium


Premium


Premium


Premium


Premium


Premium


Premium


Premium