- Home >
- Stock Photos >
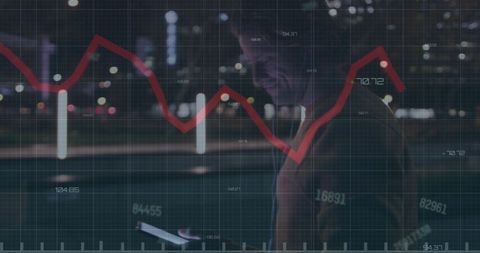
- Digital Financial Report Analysis Overlaid on Office Scene
Digital Financial Report Analysis Overlaid on Office Scene Image

Dynamic visualization featuring fluctuating financial numbers and graphs layered over an unoccupied office space. Represents concepts of financial analysis, economic trends, business strategy, and market research. Useful for illustrating financial news articles, investment reports, business presentations, and educational material on economics.
Powered by  - Get 15% off with code: PIKWIZARD15


2
downloads
downloads
Tags:
More
Credit Photo
If you would like to credit the Photo, here are some ways you can do so
Text Link
photo Link
<span class="text-link">
<span>
<a target="_blank" href=https://pikwizard.com/photo/digital-financial-report-analysis-overlaid-on-office-scene/7d653a68b18743e7074ae20987bb41c2/>PikWizard</a>
</span>
</span>
<span class="image-link">
<span
style="margin: 0 0 20px 0; display: inline-block; vertical-align: middle; width: 100%;"
>
<a
target="_blank"
href="https://pikwizard.com/photo/digital-financial-report-analysis-overlaid-on-office-scene/7d653a68b18743e7074ae20987bb41c2/"
style="text-decoration: none; font-size: 10px; margin: 0;"
>
<img src="https://pikwizard.com/pw/medium/7d653a68b18743e7074ae20987bb41c2.jpg" style="margin: 0; width: 100%;" alt="" />
<p style="font-size: 12px; margin: 0;">PikWizard</p>
</a>
</span>
</span>
Free (free of charge)
Free for personal and commercial use.
Author: Awesome Content
Similar Free Stock Images
Loading...

Premium


Premium


Premium


Premium


Premium


Premium


Premium


Premium


Premium


Premium


Premium


Premium


Premium


Premium


Premium


Premium


Premium

Premium


Premium


Premium


Premium


Premium


Premium


Premium

Premium