
- Home >
- Stock Photos >
- Digital Financial Statistics and Analytics Visualization with Graphs
Digital Financial Statistics and Analytics Visualization with Graphs Image

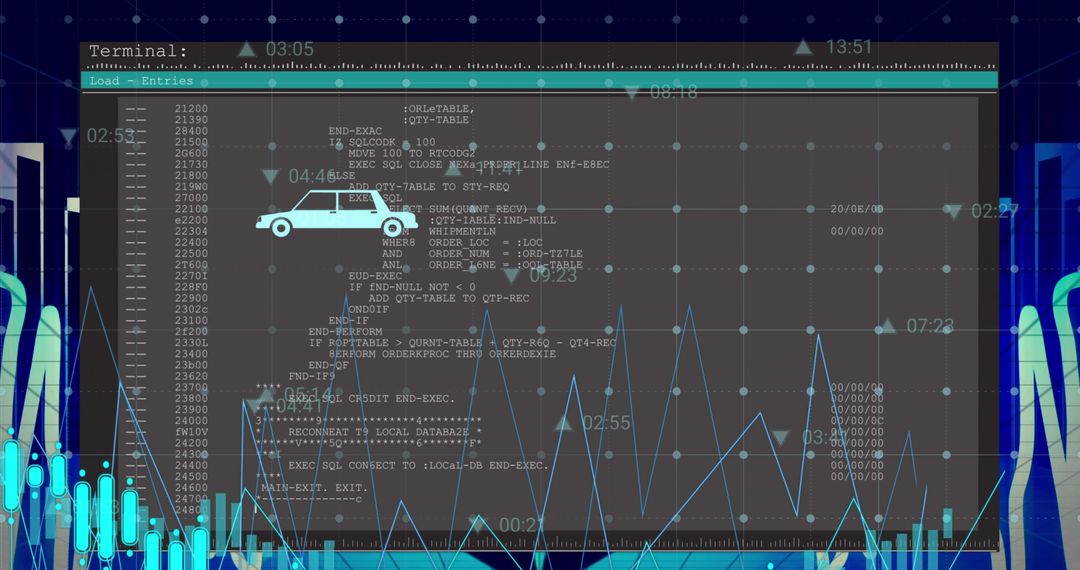
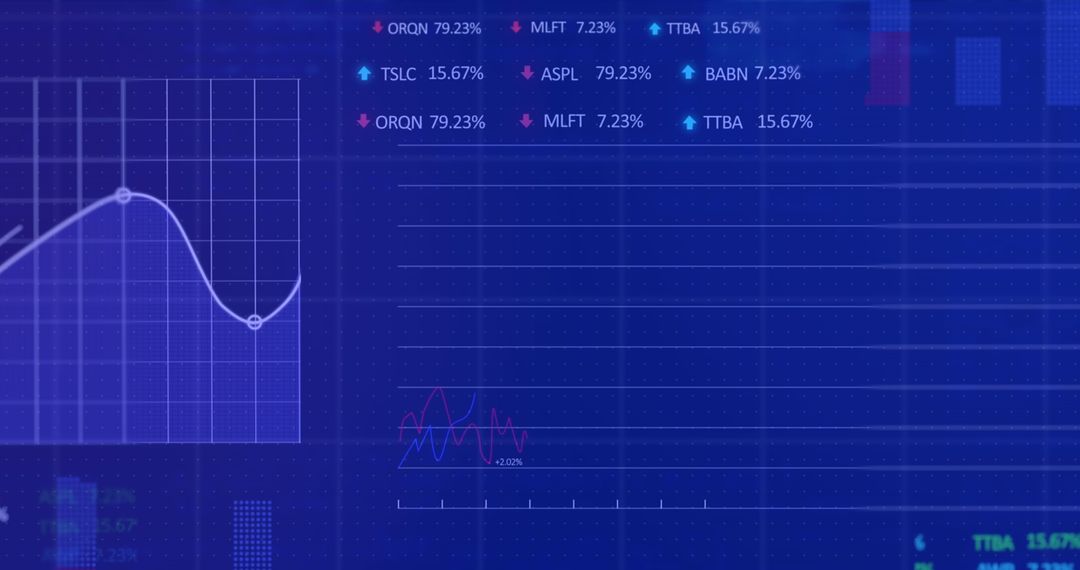
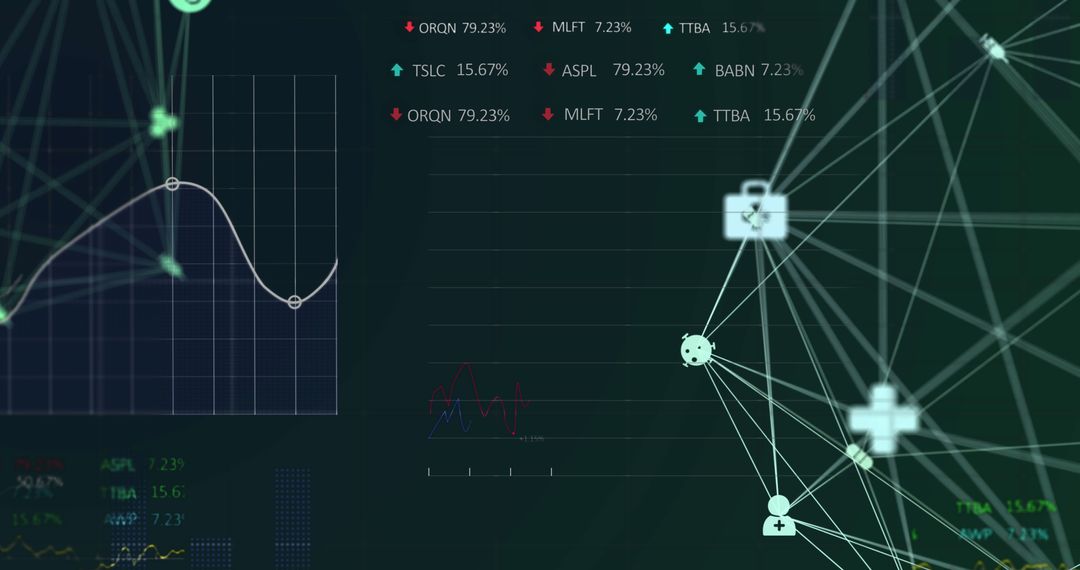
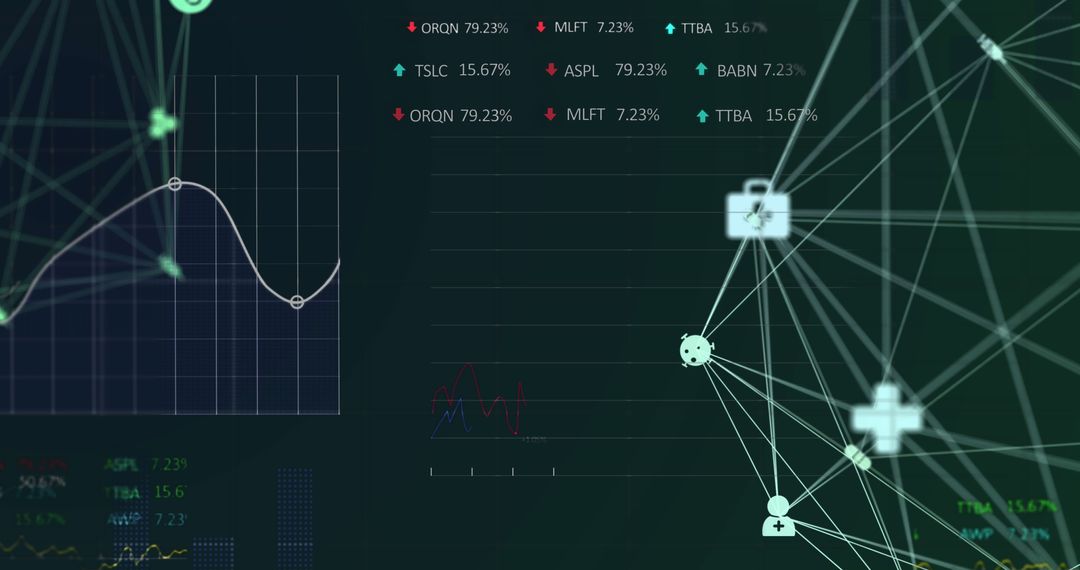
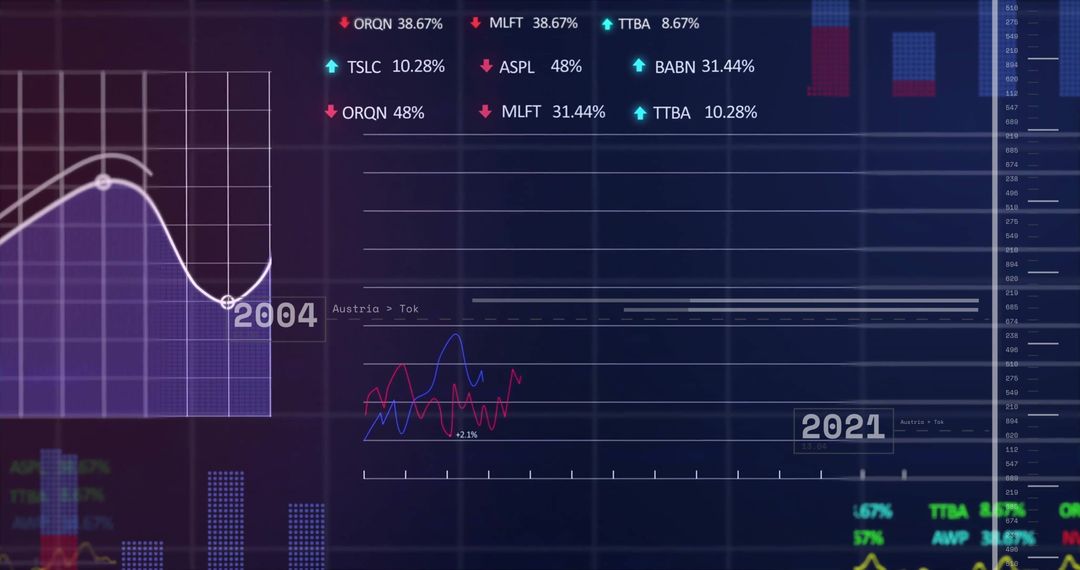
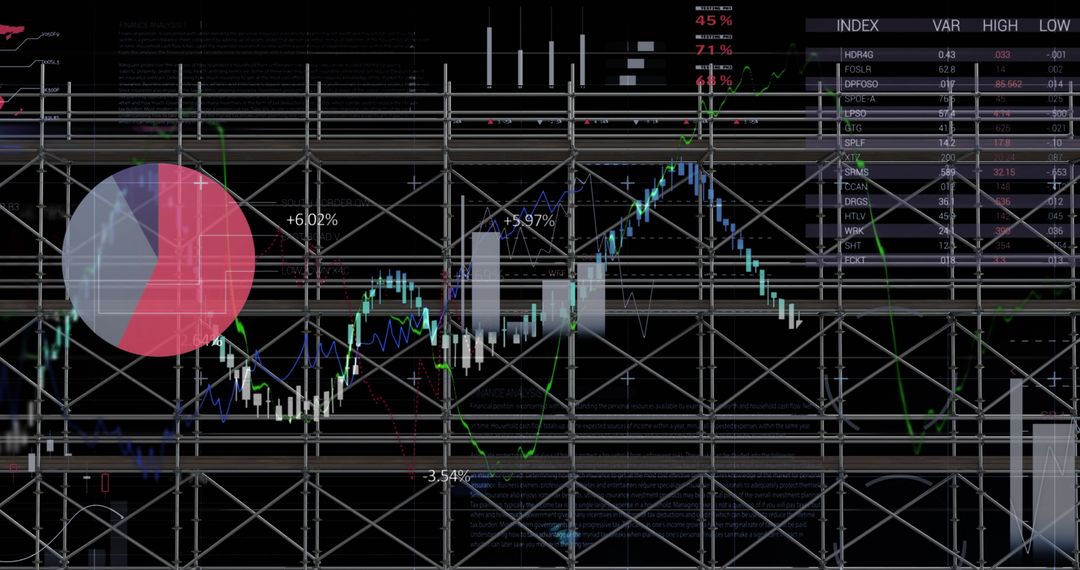
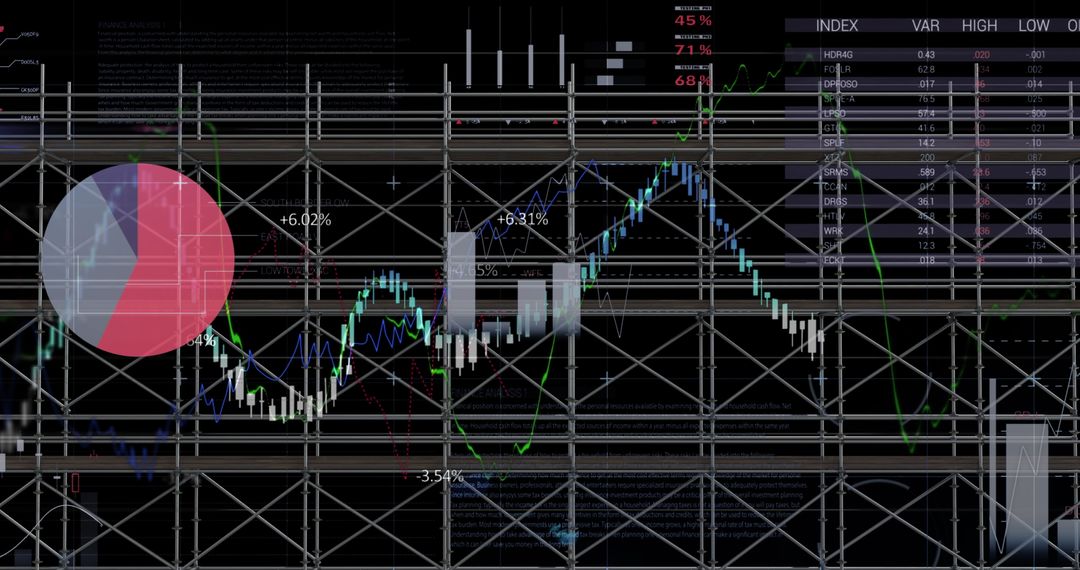
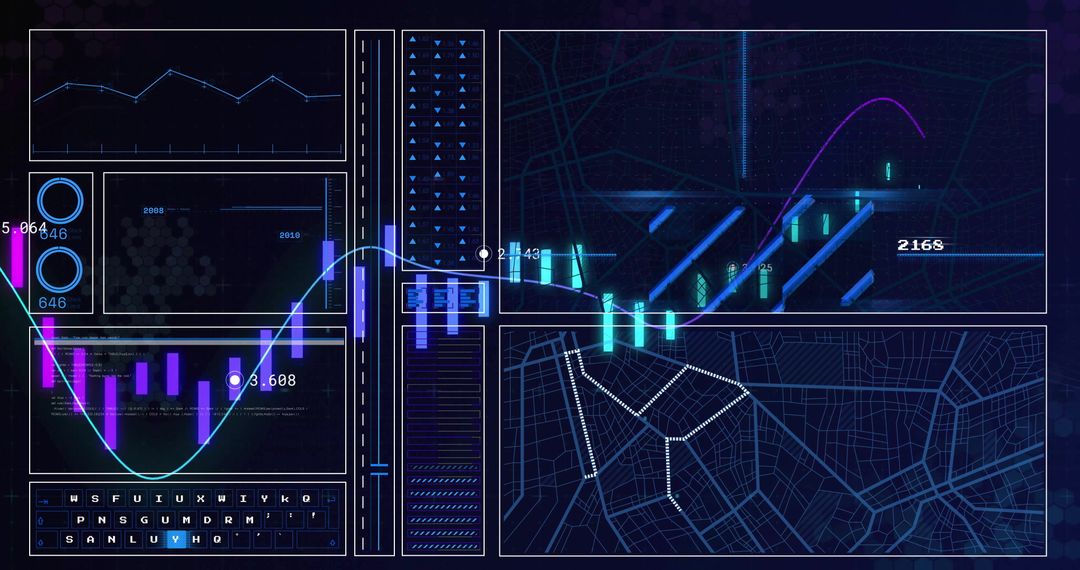
Illustrates business growth analysis with complex data graphs representing financial statistics on a digital platform. Useful for articles or presentations on stock market trends, economic reports, or financial technology advancements.
Powered by  - Get 15% off with code: PIKWIZARD15


2
downloads
downloads
Tags:
More
Credit Photo
If you would like to credit the Photo, here are some ways you can do so
Text Link
photo Link
<span class="text-link">
<span>
<a target="_blank" href=https://pikwizard.com/photo/digital-financial-statistics-and-analytics-visualization-with-graphs/83f14af0bae948f6290611f109517315/>PikWizard</a>
</span>
</span>
<span class="image-link">
<span
style="margin: 0 0 20px 0; display: inline-block; vertical-align: middle; width: 100%;"
>
<a
target="_blank"
href="https://pikwizard.com/photo/digital-financial-statistics-and-analytics-visualization-with-graphs/83f14af0bae948f6290611f109517315/"
style="text-decoration: none; font-size: 10px; margin: 0;"
>
<img src="https://pikwizard.com/pw/medium/83f14af0bae948f6290611f109517315.jpg" style="margin: 0; width: 100%;" alt="" />
<p style="font-size: 12px; margin: 0;">PikWizard</p>
</a>
</span>
</span>
Free (free of charge)
Free for personal and commercial use.
Author: Creative Art
Similar Free Stock Images

Premium


Premium


Premium


Premium


Premium


Premium


Premium


Premium


Premium


Premium


Premium


Premium


Premium


Premium


Premium


Premium


Premium


Premium


Premium


Premium


Premium


Premium


Premium


Premium

