- Home >
- Stock Photos >
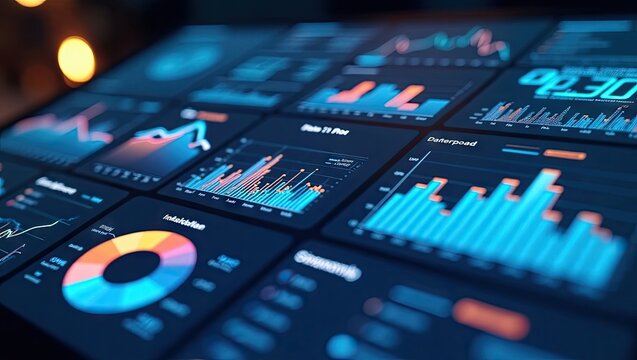
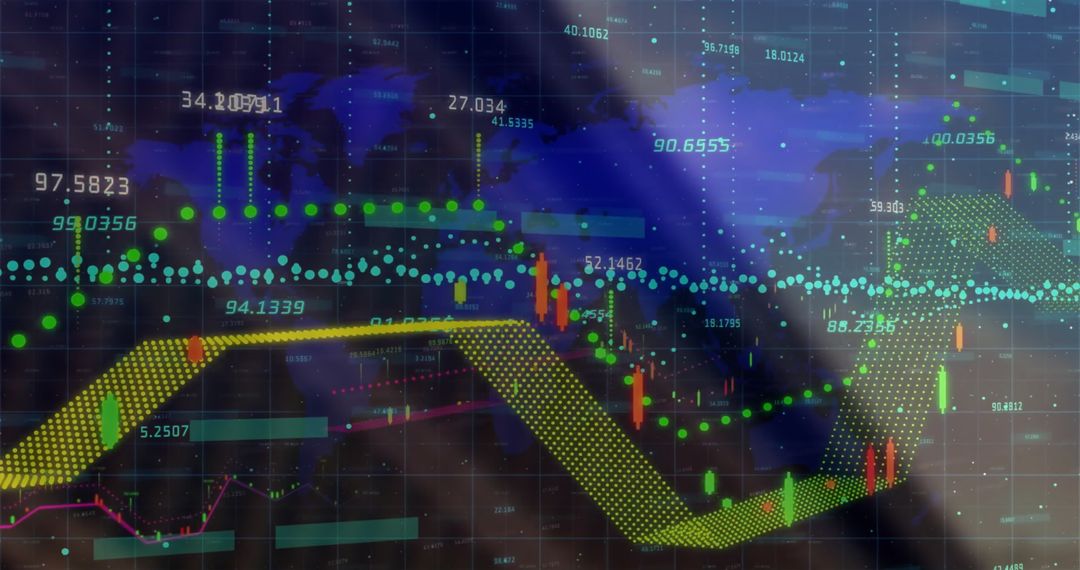
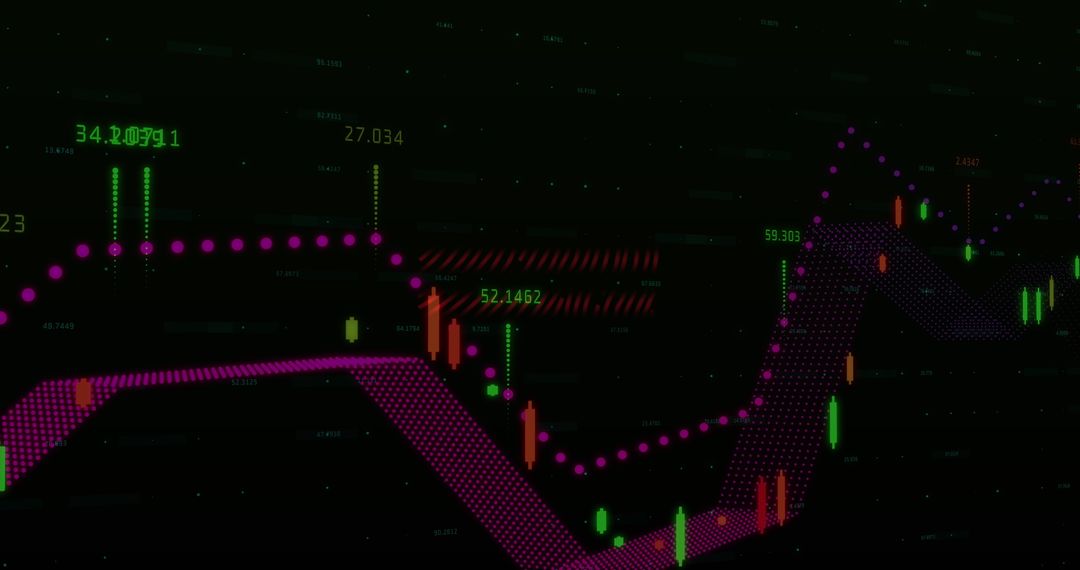
- Digital Financial Statistics and Data Over Dark Background
Digital Financial Statistics and Data Over Dark Background Image

Screen showcasing vibrant statistics and graphs, reflects concept of global finance and digital data processing. Useful for presentations on economic trends, investment strategies, or explaining financial market complexities.
Powered by 


2
downloads
downloads
Tags:
More
Credit Photo
If you would like to credit the Photo, here are some ways you can do so
Text Link
photo Link
<span class="text-link">
<span>
<a target="_blank" href=https://pikwizard.com/photo/digital-financial-statistics-and-data-over-dark-background/4f159e4a5e6424700a3d1ae5b106fc68/>PikWizard</a>
</span>
</span>
<span class="image-link">
<span
style="margin: 0 0 20px 0; display: inline-block; vertical-align: middle; width: 100%;"
>
<a
target="_blank"
href="https://pikwizard.com/photo/digital-financial-statistics-and-data-over-dark-background/4f159e4a5e6424700a3d1ae5b106fc68/"
style="text-decoration: none; font-size: 10px; margin: 0;"
>
<img src="https://pikwizard.com/pw/medium/4f159e4a5e6424700a3d1ae5b106fc68.jpg" style="margin: 0; width: 100%;" alt="" />
<p style="font-size: 12px; margin: 0;">PikWizard</p>
</a>
</span>
</span>
Free (free of charge)
Free for personal and commercial use.
Author: Awesome Content
Similar Free Stock Images

Premium


Premium


Premium


Premium


Premium


Premium


Premium


Premium


Premium


Premium


Premium


Premium


Premium


Premium


Premium


Premium


Premium


Premium


Premium


Premium


Premium


Premium


Premium


Premium