
- Home >
- Stock Photos >
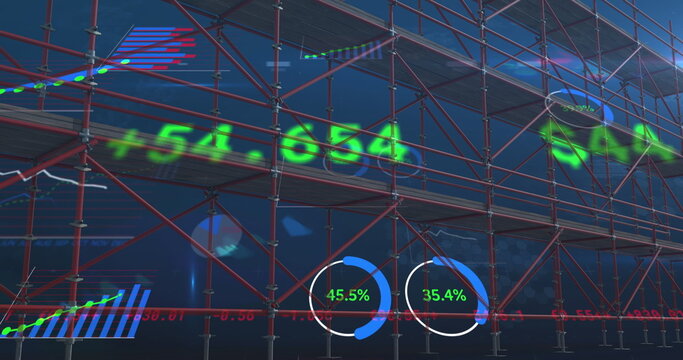
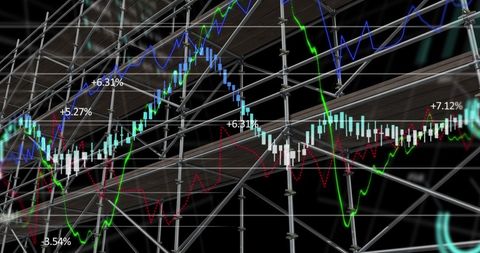
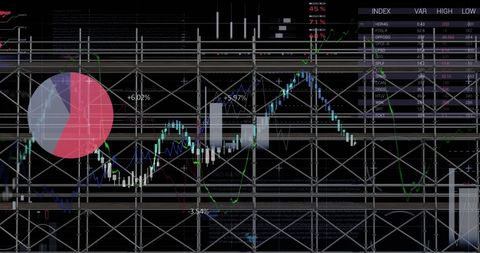
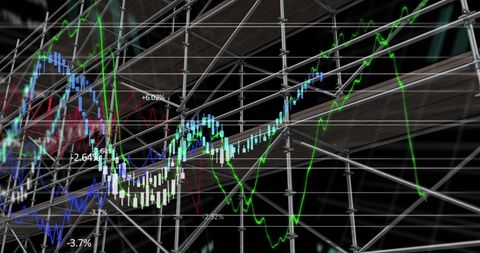
- Digital Financial Statistics with Overlaid Scaffolding and Data Charts
Digital Financial Statistics with Overlaid Scaffolding and Data Charts Image

Combination of financial statistics, scaffolding, and data charts accentuates a modern interaction between construction, finance, and technology. Useful in discussions about business growth, the evolution of financial systems, or digital analytics tools.
Powered by 


downloads
Tags:
More
Credit Photo
If you would like to credit the Photo, here are some ways you can do so
Text Link
photo Link
<span class="text-link">
<span>
<a target="_blank" href=https://pikwizard.com/photo/digital-financial-statistics-with-overlaid-scaffolding-and-data-charts/1d42e247b056771181018c66269175e0/>PikWizard</a>
</span>
</span>
<span class="image-link">
<span
style="margin: 0 0 20px 0; display: inline-block; vertical-align: middle; width: 100%;"
>
<a
target="_blank"
href="https://pikwizard.com/photo/digital-financial-statistics-with-overlaid-scaffolding-and-data-charts/1d42e247b056771181018c66269175e0/"
style="text-decoration: none; font-size: 10px; margin: 0;"
>
<img src="https://pikwizard.com/pw/medium/1d42e247b056771181018c66269175e0.jpg" style="margin: 0; width: 100%;" alt="" />
<p style="font-size: 12px; margin: 0;">PikWizard</p>
</a>
</span>
</span>
Free (free of charge)
Free for personal and commercial use.
Author: People Creations
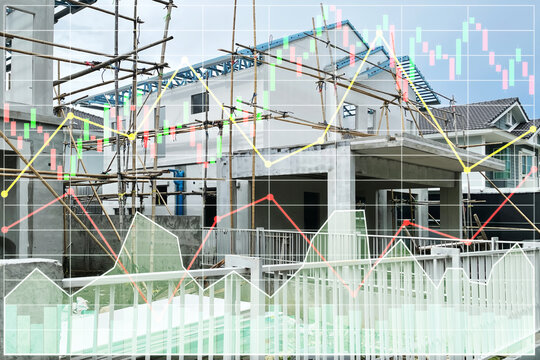
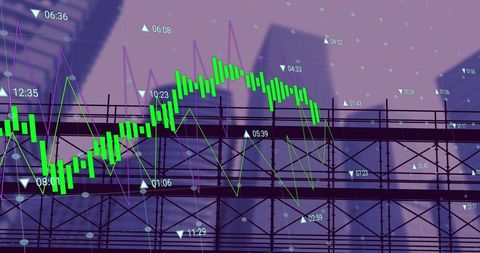
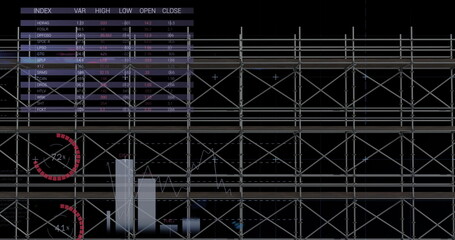
Similar Free Stock Images

Premium


Premium

Premium


Premium


Premium

Premium

Premium


Premium


Premium


Premium

Premium


Premium

Premium

Premium


Explore More Free Stock Images