
- Home >
- Stock Photos >
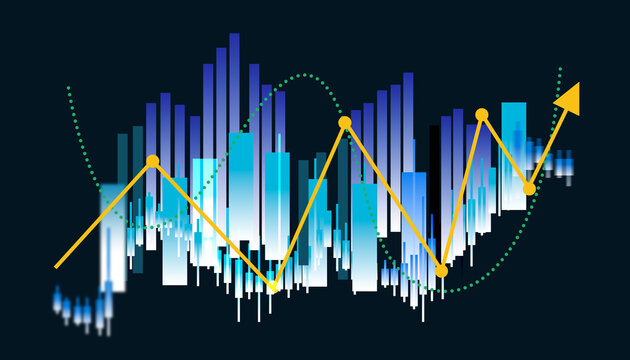
- Digital Financial Trading Chart with Candlestick Patterns
Digital Financial Trading Chart with Candlestick Patterns Image
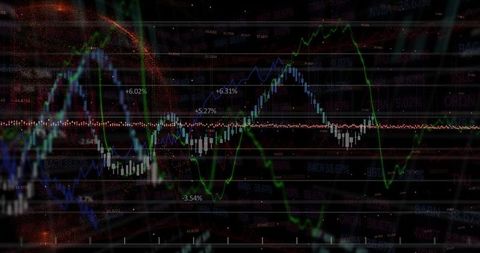
Illustration presents dynamic financial trading interface with candlestick chart, colorful line graph, and percentage displays, indicative of real-time market data analytics. Useful for articles or presentations about finance, economics, investment strategies, business intelligence tools, or technology in trading.
Powered by 


0
downloads
downloads
Tags:
More
Credit Photo
If you would like to credit the Photo, here are some ways you can do so
Text Link
photo Link
<span class="text-link">
<span>
<a target="_blank" href=https://pikwizard.com/photo/digital-financial-trading-chart-with-candlestick-patterns/49ac1556a721bccb69829248b7380fa7/>PikWizard</a>
</span>
</span>
<span class="image-link">
<span
style="margin: 0 0 20px 0; display: inline-block; vertical-align: middle; width: 100%;"
>
<a
target="_blank"
href="https://pikwizard.com/photo/digital-financial-trading-chart-with-candlestick-patterns/49ac1556a721bccb69829248b7380fa7/"
style="text-decoration: none; font-size: 10px; margin: 0;"
>
<img src="https://pikwizard.com/pw/medium/49ac1556a721bccb69829248b7380fa7.jpg" style="margin: 0; width: 100%;" alt="" />
<p style="font-size: 12px; margin: 0;">PikWizard</p>
</a>
</span>
</span>
Free (free of charge)
Free for personal and commercial use.
Author: Creative Art