- Home >
- Stock Photos >
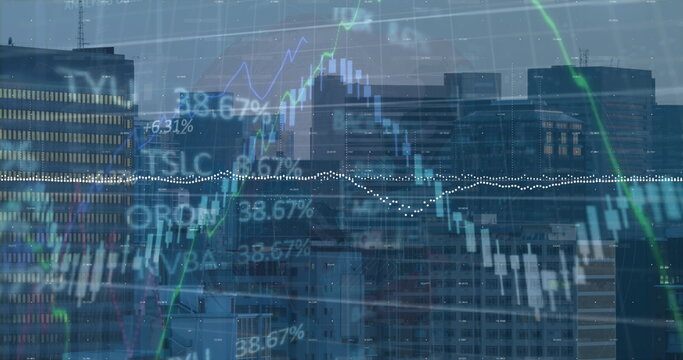
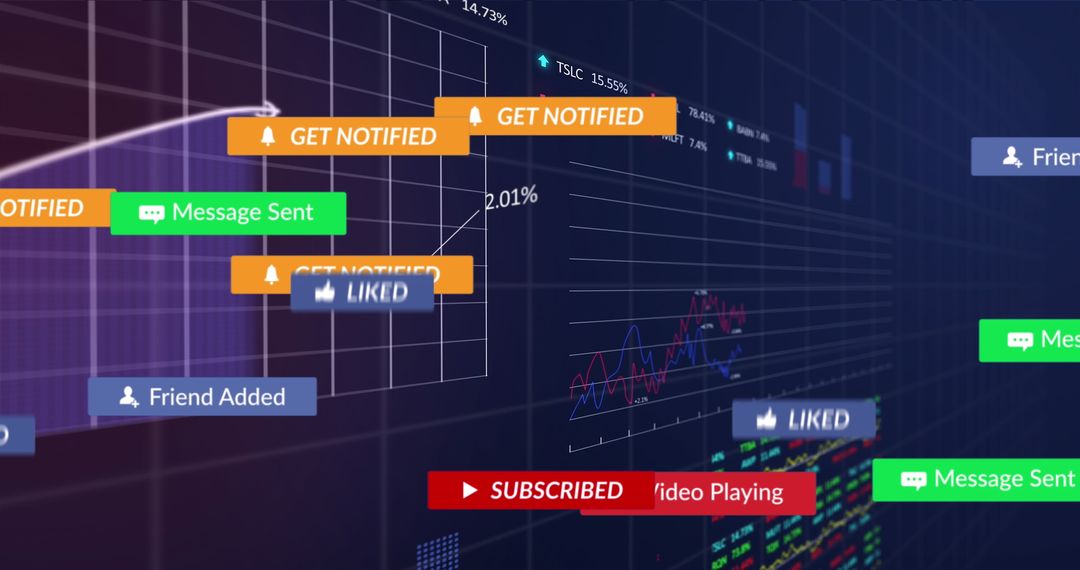
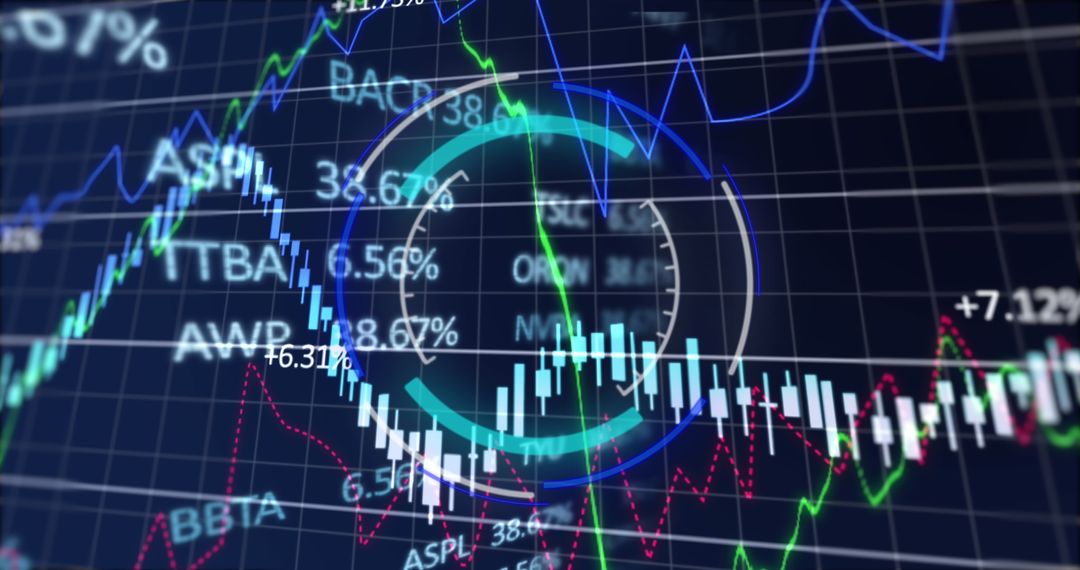
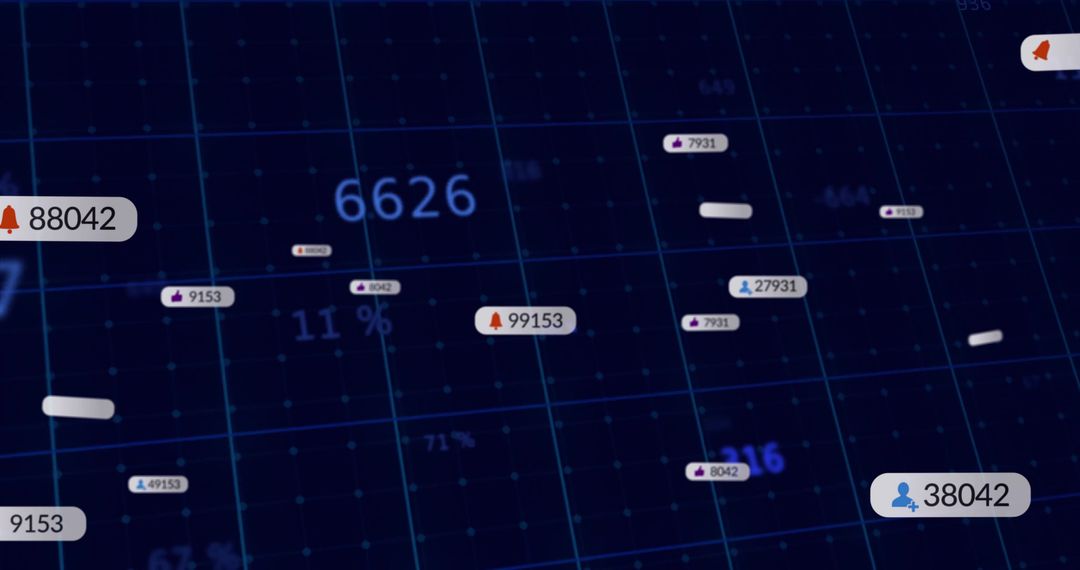
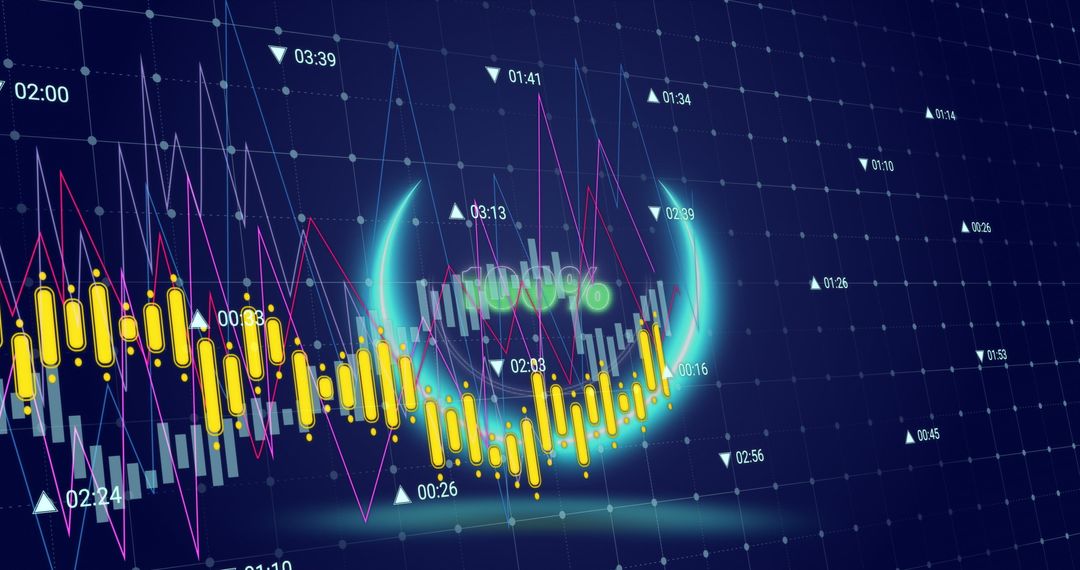
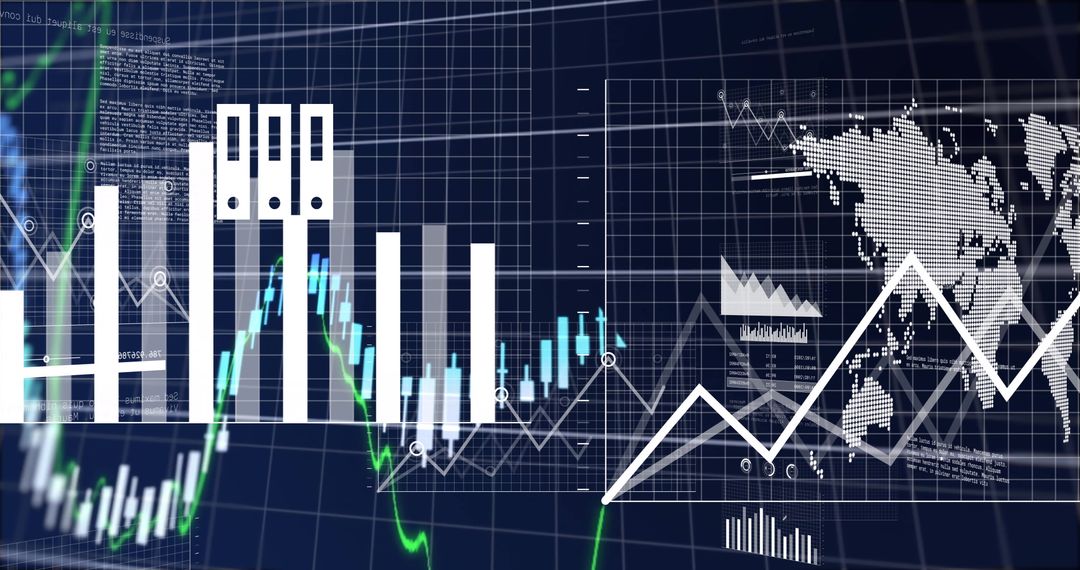
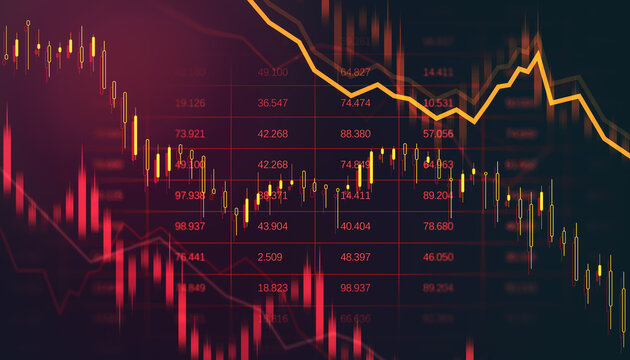
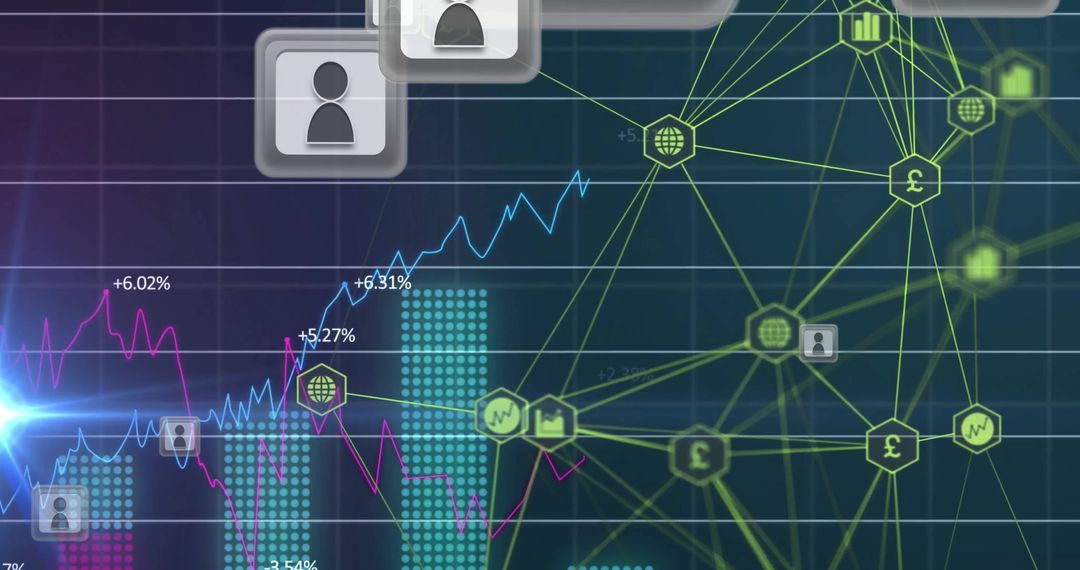
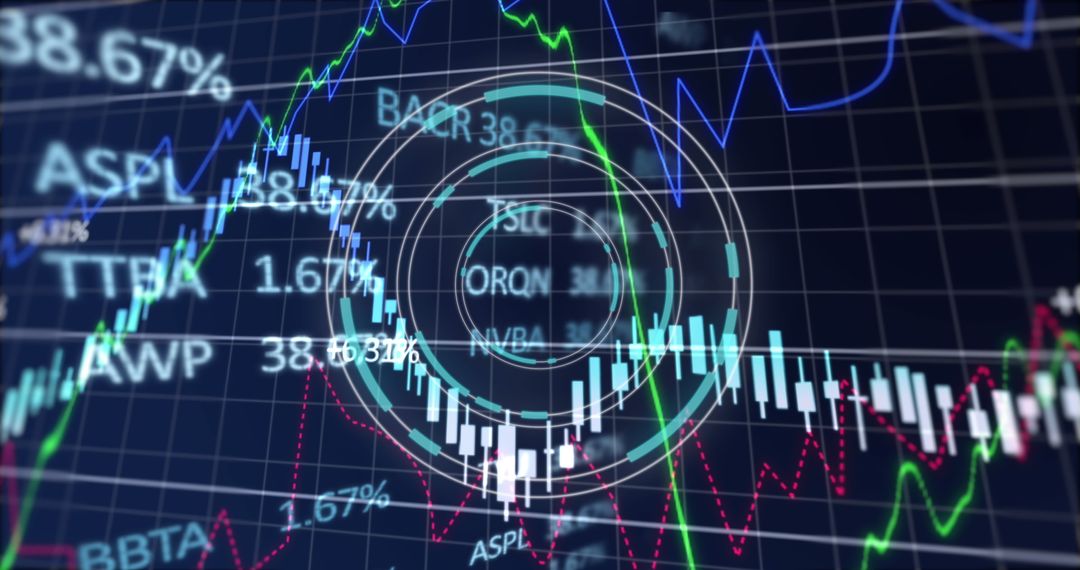
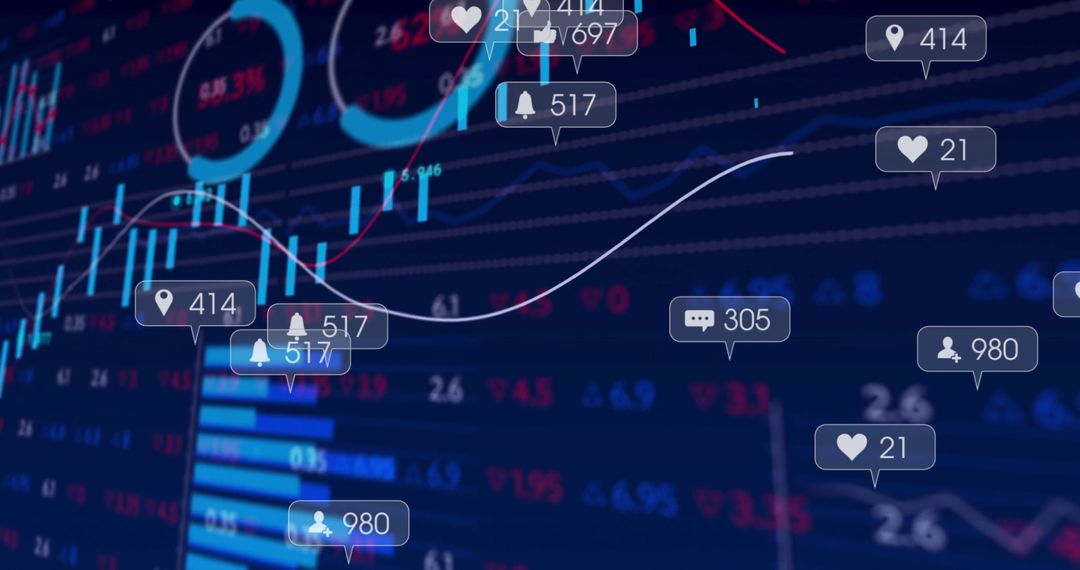
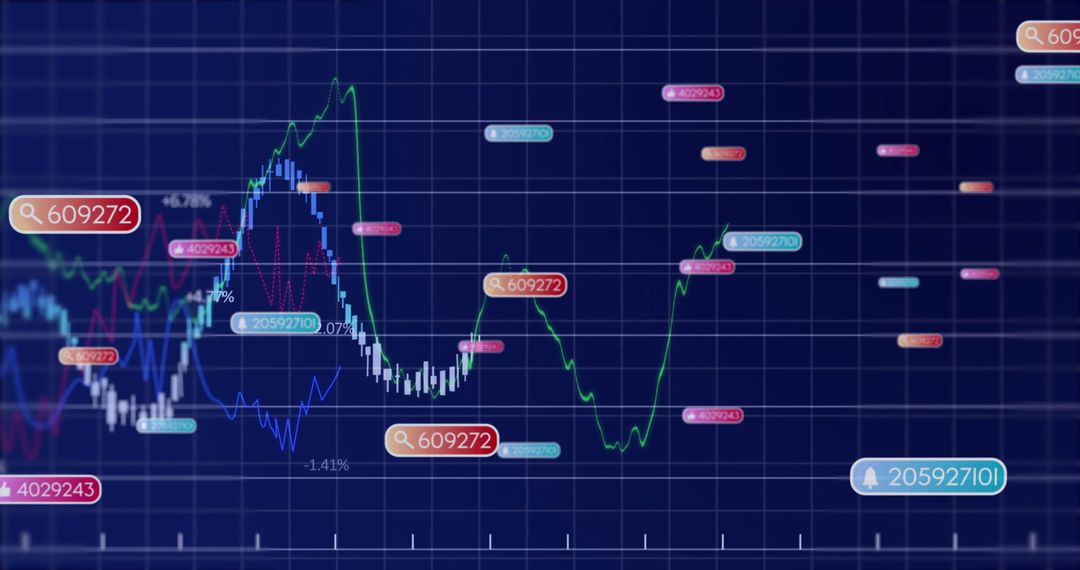
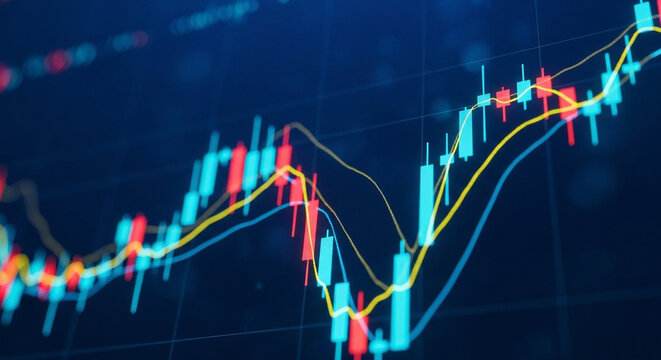
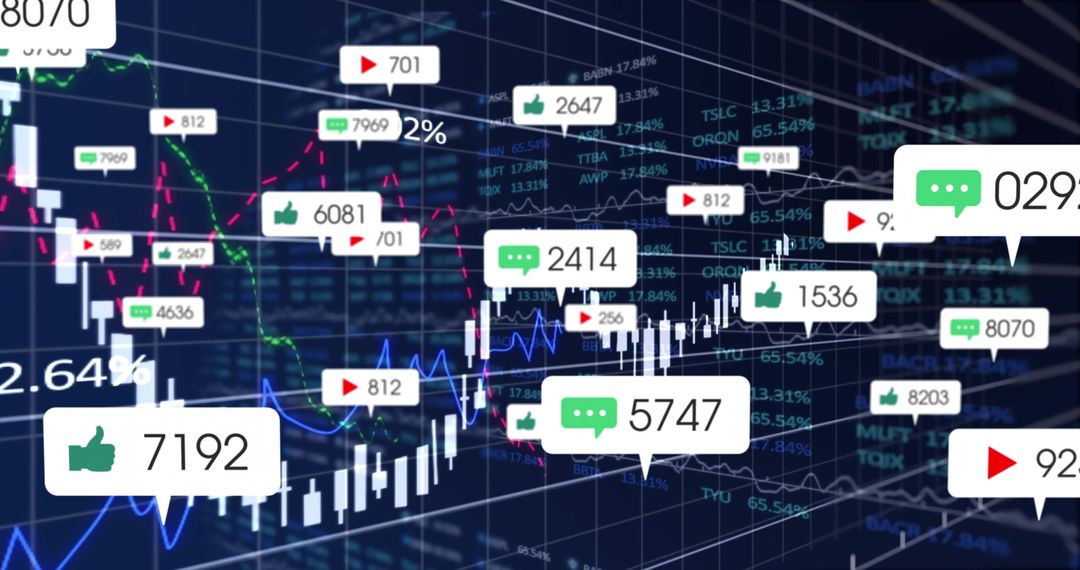
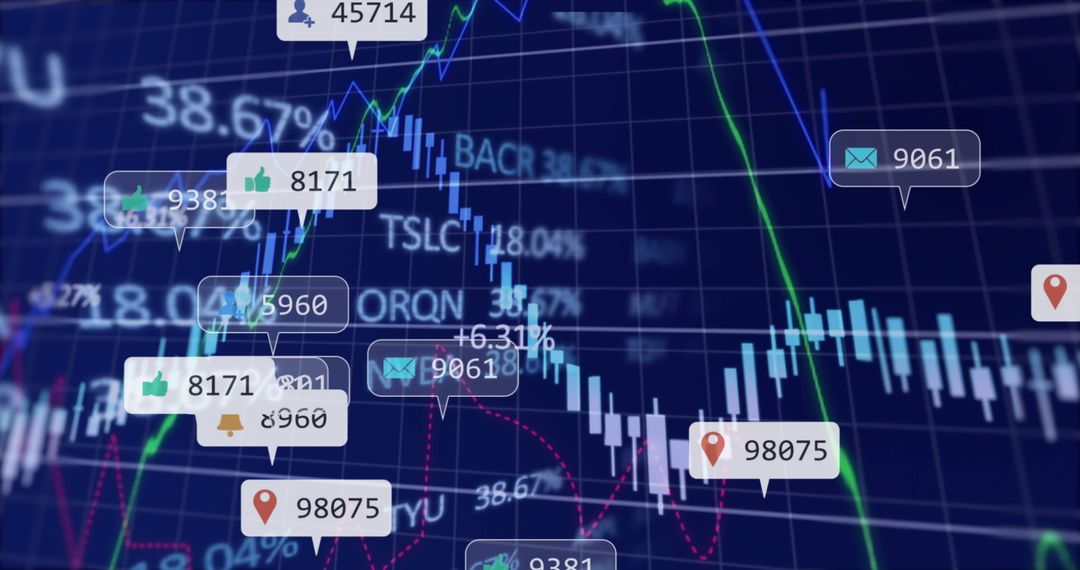
- Digital Financial Trading Chart with Candlesticks and Data Labels
Digital Financial Trading Chart with Candlesticks and Data Labels Image
This image showcases a financial trading chart featuring candlesticks, data labels, and intersecting lines, depicted with digital display. Ideal for illustrating concepts in stock market trading, data analysis, or financial technology on websites, reports, or presentations related to investment and trading.
Powered by 


2
downloads
downloads
Tags:
More
Credit Photo
If you would like to credit the Photo, here are some ways you can do so
Text Link
photo Link
<span class="text-link">
<span>
<a target="_blank" href=https://pikwizard.com/photo/digital-financial-trading-chart-with-candlesticks-and-data-labels/bea11f1bbcfd15fa9883f922313df775/>PikWizard</a>
</span>
</span>
<span class="image-link">
<span
style="margin: 0 0 20px 0; display: inline-block; vertical-align: middle; width: 100%;"
>
<a
target="_blank"
href="https://pikwizard.com/photo/digital-financial-trading-chart-with-candlesticks-and-data-labels/bea11f1bbcfd15fa9883f922313df775/"
style="text-decoration: none; font-size: 10px; margin: 0;"
>
<img src="https://pikwizard.com/pw/medium/bea11f1bbcfd15fa9883f922313df775.jpg" style="margin: 0; width: 100%;" alt="" />
<p style="font-size: 12px; margin: 0;">PikWizard</p>
</a>
</span>
</span>
Free (free of charge)
Free for personal and commercial use.
Author: People Creations
Similar Free Stock Images

Premium


Premium


Premium


Premium


Premium


Premium


Premium


Premium


Premium


Premium


Premium


Premium


Premium


Premium


Premium


Premium


Premium


Premium


Premium


Premium


Premium


Premium


Premium

Premium