- Home >
- Stock Photos >
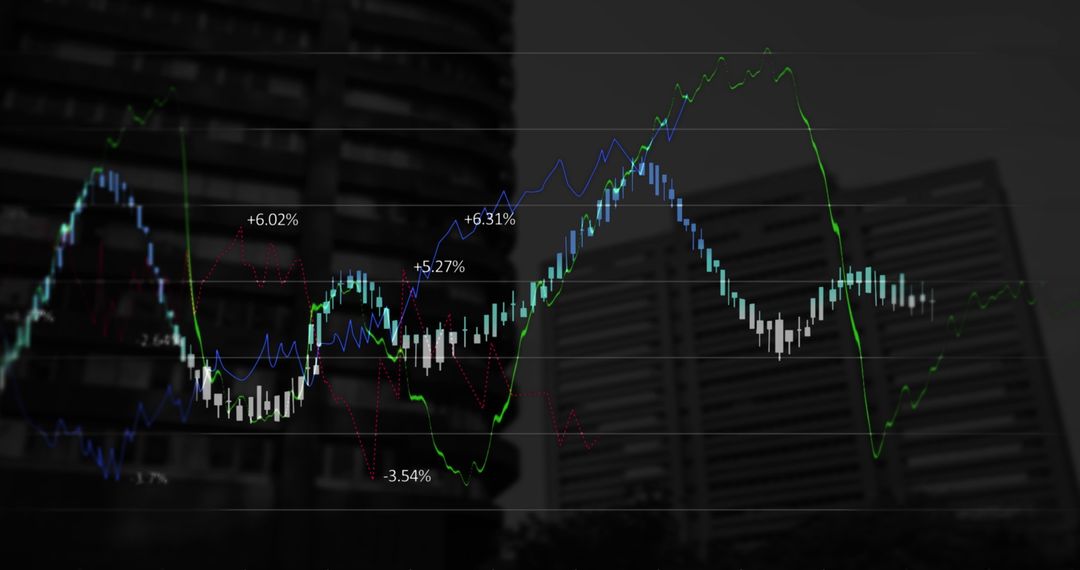
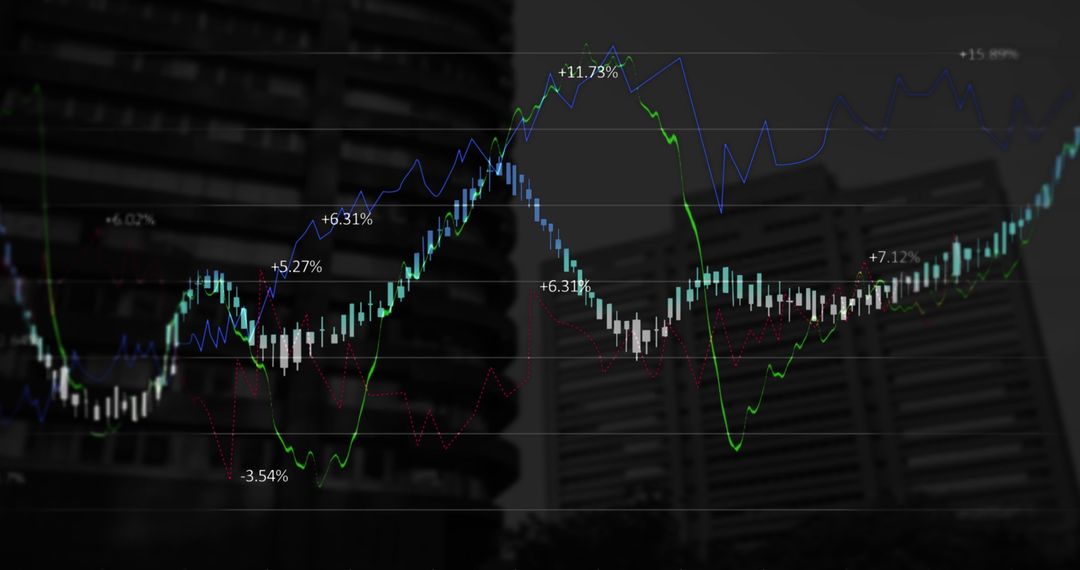
- Digital Forex Data Over City Skyline Visualizing Market Trends
Digital Forex Data Over City Skyline Visualizing Market Trends Image

Graphic showing digital financial data with candlestick and line charts overlaid on a city skyscraper view, representing dynamic market analysis and investment technology. Ideal for illustrating concepts in global finance, business reports, statistical analysis workshops, and educational materials focused on trading methodologies.
Powered by  - Get 15% off with code: PIKWIZARD15


5
downloads
downloads
Tags:
More
Credit Photo
If you would like to credit the Photo, here are some ways you can do so
Text Link
photo Link
<span class="text-link">
<span>
<a target="_blank" href=https://pikwizard.com/photo/digital-forex-data-over-city-skyline-visualizing-market-trends/ae0dba6cc031e4f5424471d0dcb37126/>PikWizard</a>
</span>
</span>
<span class="image-link">
<span
style="margin: 0 0 20px 0; display: inline-block; vertical-align: middle; width: 100%;"
>
<a
target="_blank"
href="https://pikwizard.com/photo/digital-forex-data-over-city-skyline-visualizing-market-trends/ae0dba6cc031e4f5424471d0dcb37126/"
style="text-decoration: none; font-size: 10px; margin: 0;"
>
<img src="https://pikwizard.com/pw/medium/ae0dba6cc031e4f5424471d0dcb37126.jpg" style="margin: 0; width: 100%;" alt="" />
<p style="font-size: 12px; margin: 0;">PikWizard</p>
</a>
</span>
</span>
Free (free of charge)
Free for personal and commercial use.
Author: Awesome Content
Similar Free Stock Images

Premium


Premium


Premium


Premium


Premium


Premium


Premium


Premium


Premium


Premium


Premium


Premium


Premium


Premium


Premium


Premium


Premium


Premium


Premium


Premium


Premium


Premium


Premium


Premium