
- Home >
- Stock Photos >
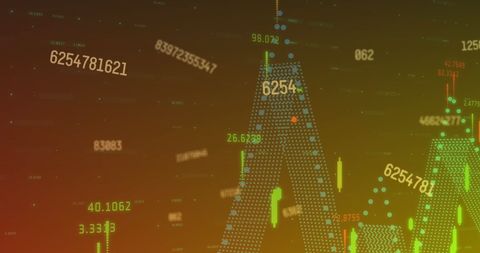
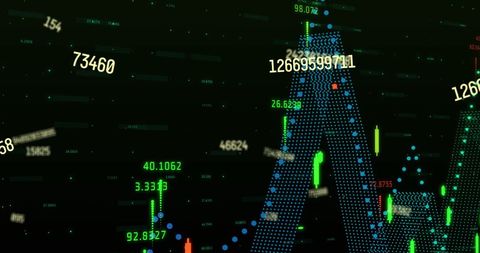
- Digital Forex Data Visualization with Growing Trend
Digital Forex Data Visualization with Growing Trend Image
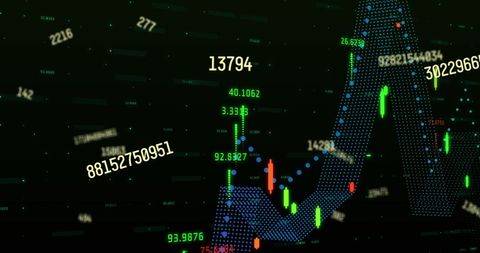
Visualization of dynamic and colorful digital financial data with a focus on market trends, candlestick patterns, and numerical growth. Ideal for articles or presentations on forex trading, economic trends, financial markets analysis, and trading technology advancements.
Powered by 


downloads
Tags:
More
Credit Photo
If you would like to credit the Photo, here are some ways you can do so
Text Link
photo Link
<span class="text-link">
<span>
<a target="_blank" href=https://pikwizard.com/photo/digital-forex-data-visualization-with-growing-trend/2c3af6bf3bb92fd5afc1417437d49328/>PikWizard</a>
</span>
</span>
<span class="image-link">
<span
style="margin: 0 0 20px 0; display: inline-block; vertical-align: middle; width: 100%;"
>
<a
target="_blank"
href="https://pikwizard.com/photo/digital-forex-data-visualization-with-growing-trend/2c3af6bf3bb92fd5afc1417437d49328/"
style="text-decoration: none; font-size: 10px; margin: 0;"
>
<img src="https://pikwizard.com/pw/medium/2c3af6bf3bb92fd5afc1417437d49328.jpg" style="margin: 0; width: 100%;" alt="" />
<p style="font-size: 12px; margin: 0;">PikWizard</p>
</a>
</span>
</span>
Free (free of charge)
Free for personal and commercial use.
Author: Awesome Content
Similar Free Stock Images

Premium


Premium

Premium

Premium


Premium


Premium


Premium


Premium


Premium

Premium


Premium


Premium


Premium


Premium

Premium


Premium

Premium


Premium


Premium


Premium


Premium


Premium


Premium


Premium


Premium


Explore More Free Stock Images