
- Home >
- Stock Photos >
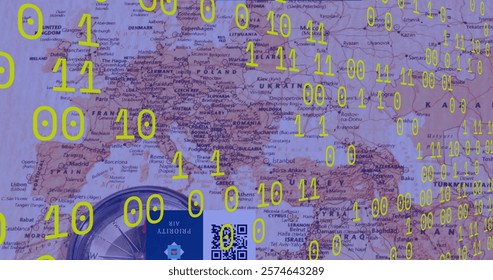
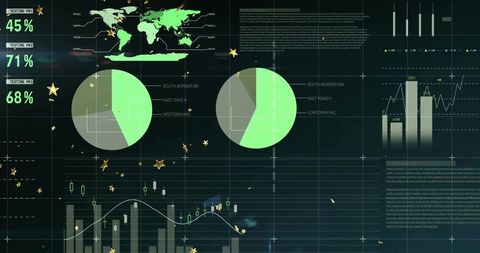
- Digital Global Data Analysis and Binary Code Interface
Digital Global Data Analysis and Binary Code Interface Image

The image depicts a digital interface with data processing and binary code overlaying a blue background. Featuring world map and pie charts, it illustrates a global perspective on business data analysis. This image is ideal for use in presentations or reports related to technology, financial analysis, global strategy, and digital transformation.
Powered by  - Get 15% off with code: PIKWIZARD15


downloads
Tags:
More
Credit Photo
If you would like to credit the Photo, here are some ways you can do so
Text Link
photo Link
<span class="text-link">
<span>
<a target="_blank" href=https://pikwizard.com/photo/digital-global-data-analysis-and-binary-code-interface/f1c31d8da795588ac020e890ad3cb9ec/>PikWizard</a>
</span>
</span>
<span class="image-link">
<span
style="margin: 0 0 20px 0; display: inline-block; vertical-align: middle; width: 100%;"
>
<a
target="_blank"
href="https://pikwizard.com/photo/digital-global-data-analysis-and-binary-code-interface/f1c31d8da795588ac020e890ad3cb9ec/"
style="text-decoration: none; font-size: 10px; margin: 0;"
>
<img src="https://pikwizard.com/pw/medium/f1c31d8da795588ac020e890ad3cb9ec.jpg" style="margin: 0; width: 100%;" alt="" />
<p style="font-size: 12px; margin: 0;">PikWizard</p>
</a>
</span>
</span>
Free (free of charge)
Free for personal and commercial use.
Author: Authentic Images
Similar Free Stock Images

Premium

Premium

Premium


Premium


Premium


Premium


Premium


Premium


Premium

Premium

Premium


Premium


Premium


Premium


Premium


Premium


Premium


Premium


Premium


Premium

Premium


Premium


Premium

Premium


Premium


Explore More Free Stock Images