
- Home >
- Stock Photos >
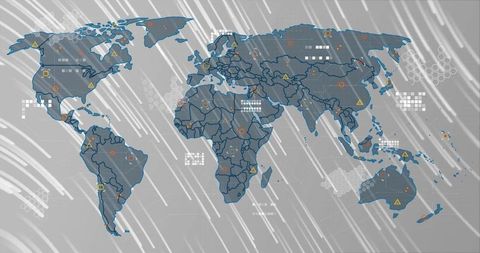
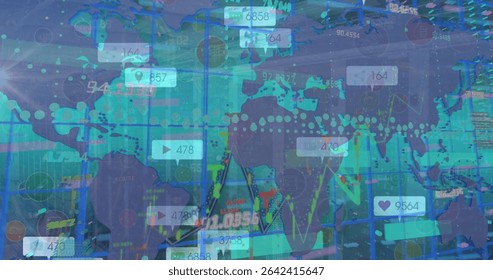
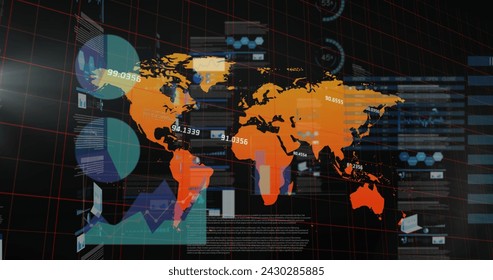
- Digital Global Data Framework with World Map and Statistical Graphs
Digital Global Data Framework with World Map and Statistical Graphs Image

Graphical interpretation of statistical data overlays on world map representing connectivity and data processing. Ideal for illustrating technologies in communications, global analysis, and digital innovation. Use in contexts of tech advancement to convey complex data interaction and global trends.
Powered by  - Get 15% off with code: PIKWIZARD15


downloads
Tags:
More
Credit Photo
If you would like to credit the Photo, here are some ways you can do so
Text Link
photo Link
<span class="text-link">
<span>
<a target="_blank" href=https://pikwizard.com/photo/digital-global-data-framework-with-world-map-and-statistical-graphs/90489f96b50305616e8d6532fd7d97cb/>PikWizard</a>
</span>
</span>
<span class="image-link">
<span
style="margin: 0 0 20px 0; display: inline-block; vertical-align: middle; width: 100%;"
>
<a
target="_blank"
href="https://pikwizard.com/photo/digital-global-data-framework-with-world-map-and-statistical-graphs/90489f96b50305616e8d6532fd7d97cb/"
style="text-decoration: none; font-size: 10px; margin: 0;"
>
<img src="https://pikwizard.com/pw/medium/90489f96b50305616e8d6532fd7d97cb.jpg" style="margin: 0; width: 100%;" alt="" />
<p style="font-size: 12px; margin: 0;">PikWizard</p>
</a>
</span>
</span>
Free (free of charge)
Free for personal and commercial use.
Author: Awesome Content
Similar Free Stock Images

Premium


Premium


Premium


Premium


Premium


Premium

Premium

Premium


Premium


Premium


Premium


Premium


Premium


Premium


Premium


Premium


Premium


Premium


Premium


Premium

Premium


Premium

Premium


Premium


Premium


Explore More Free Stock Images