- Home >
- Stock Photos >
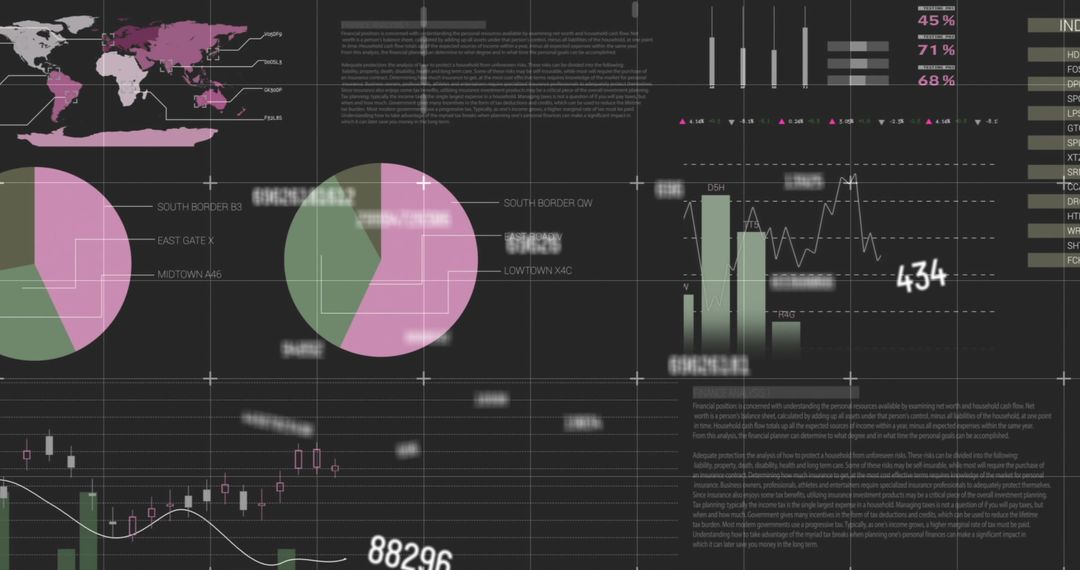
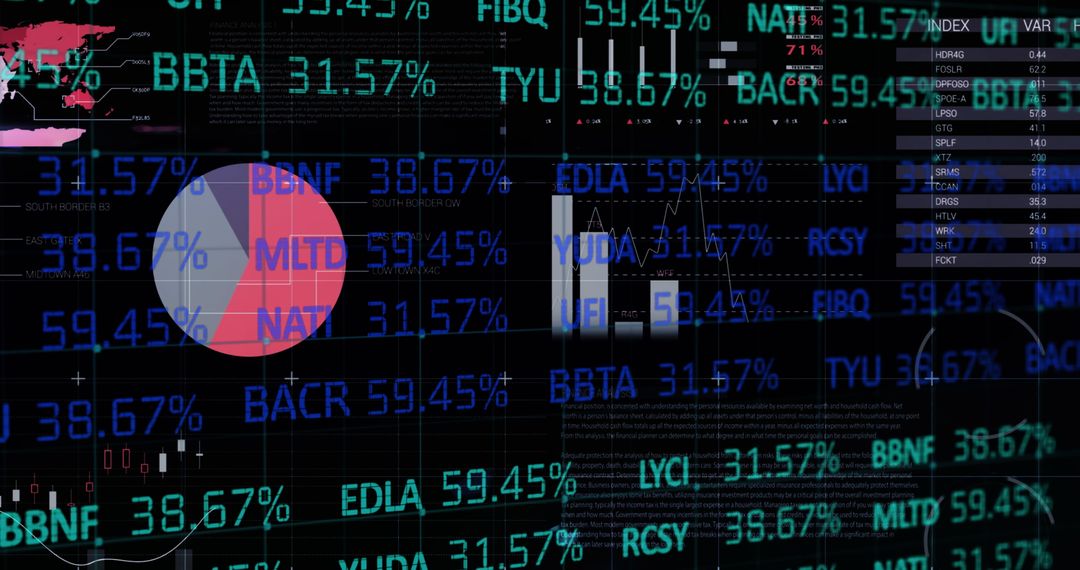
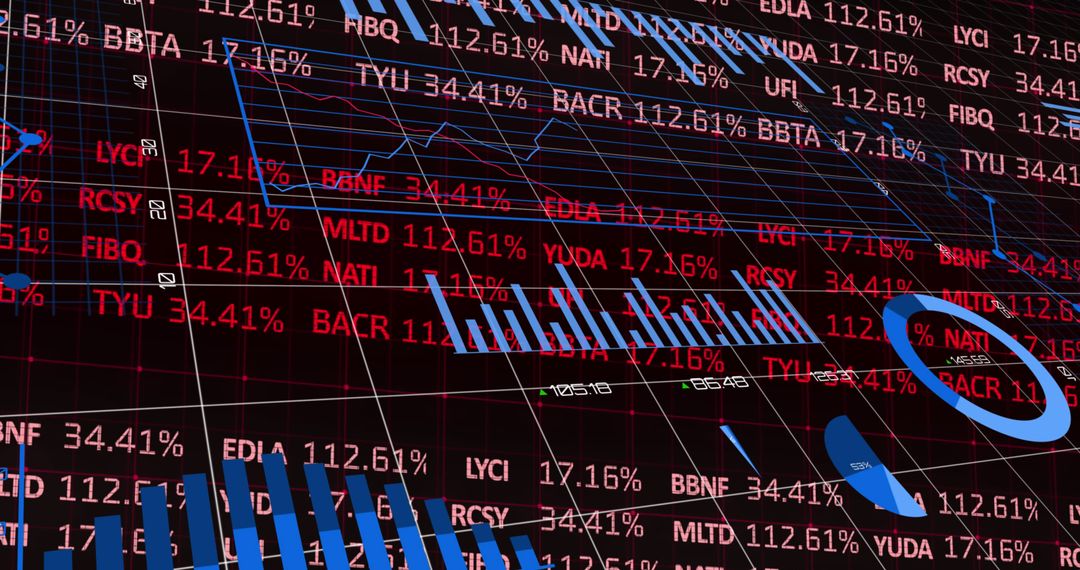
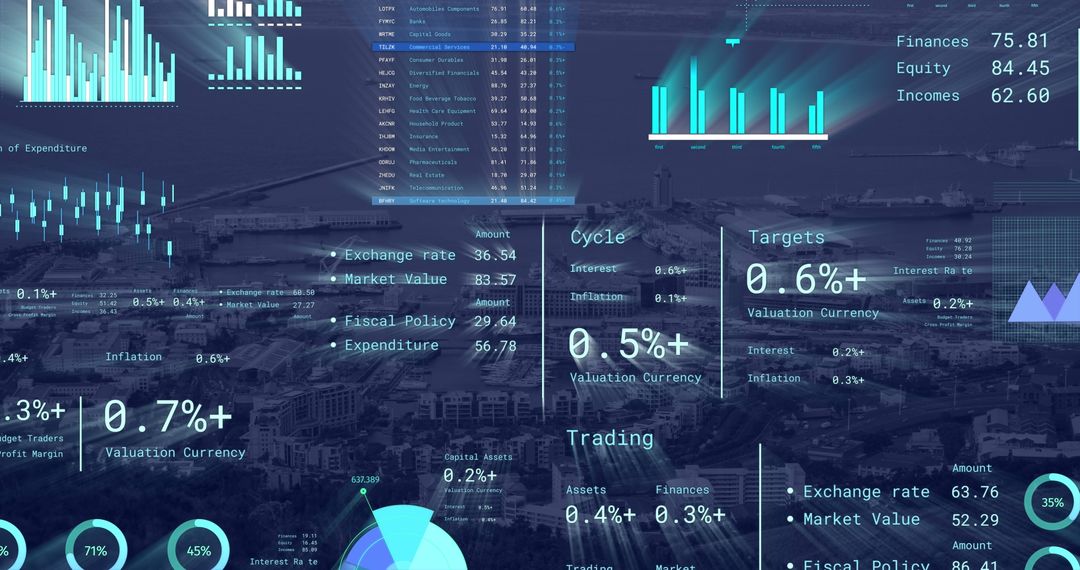
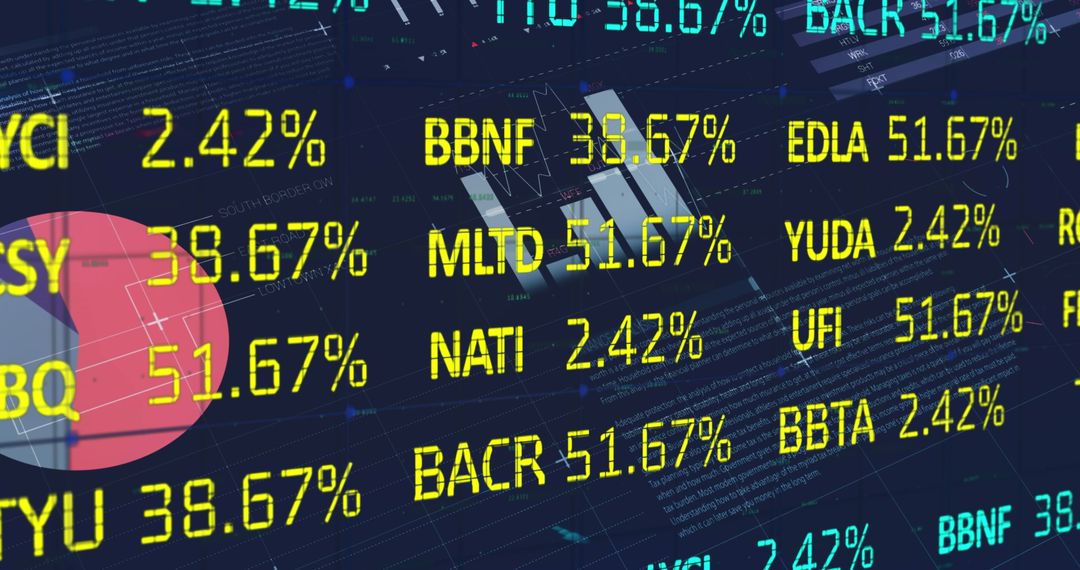
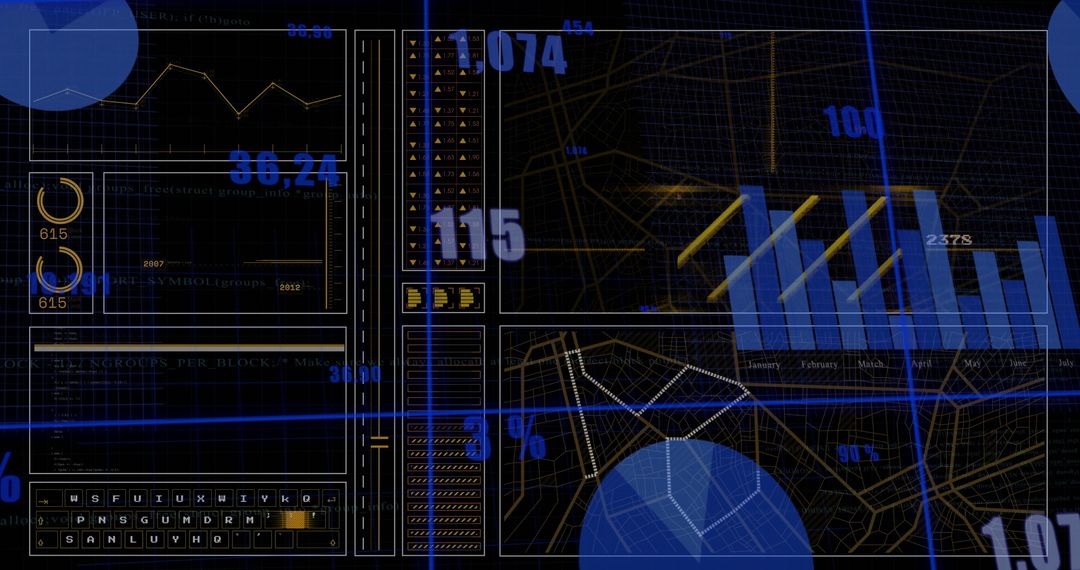
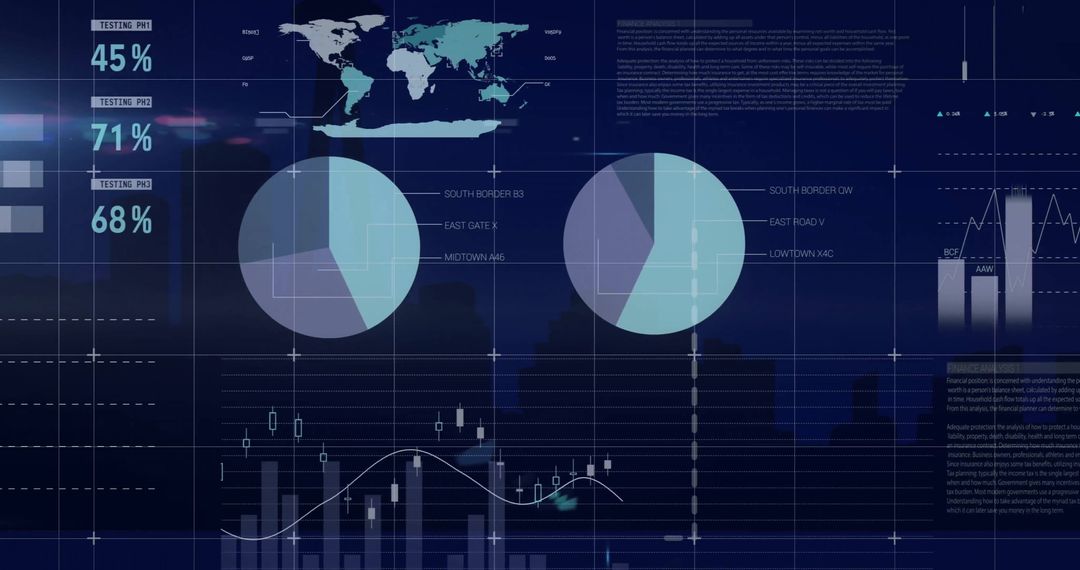
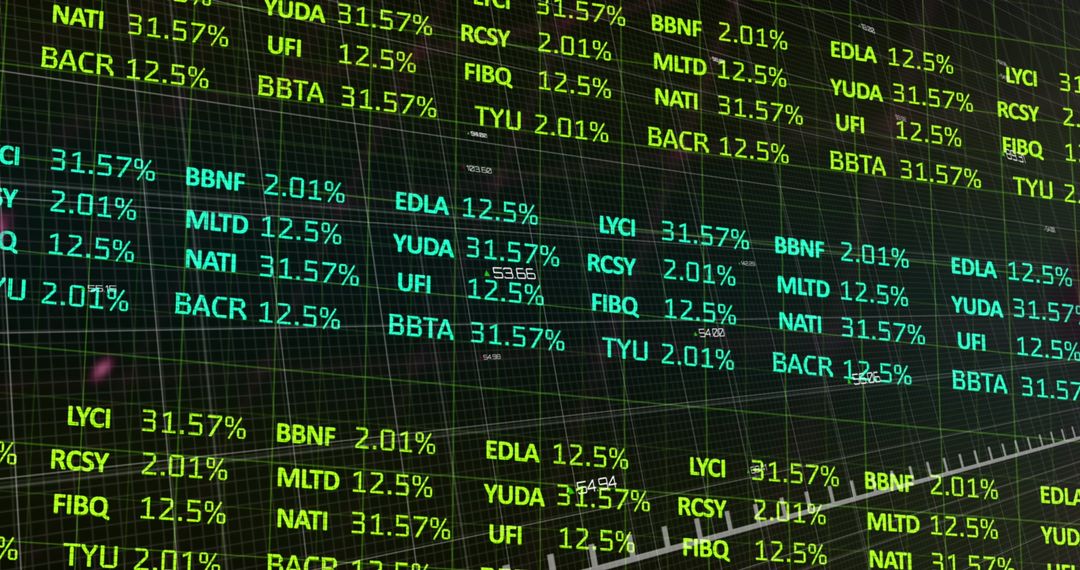
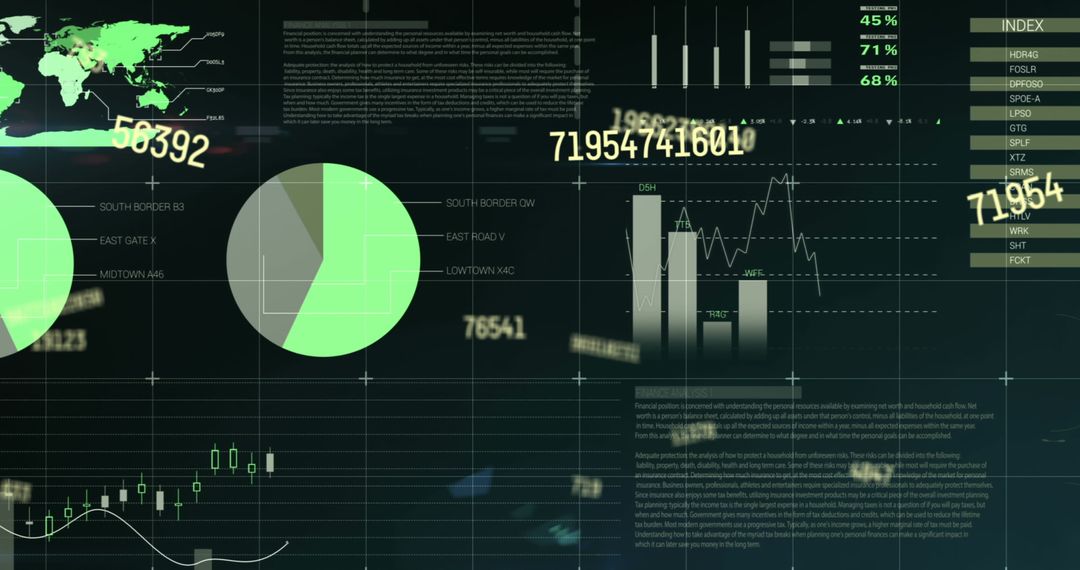
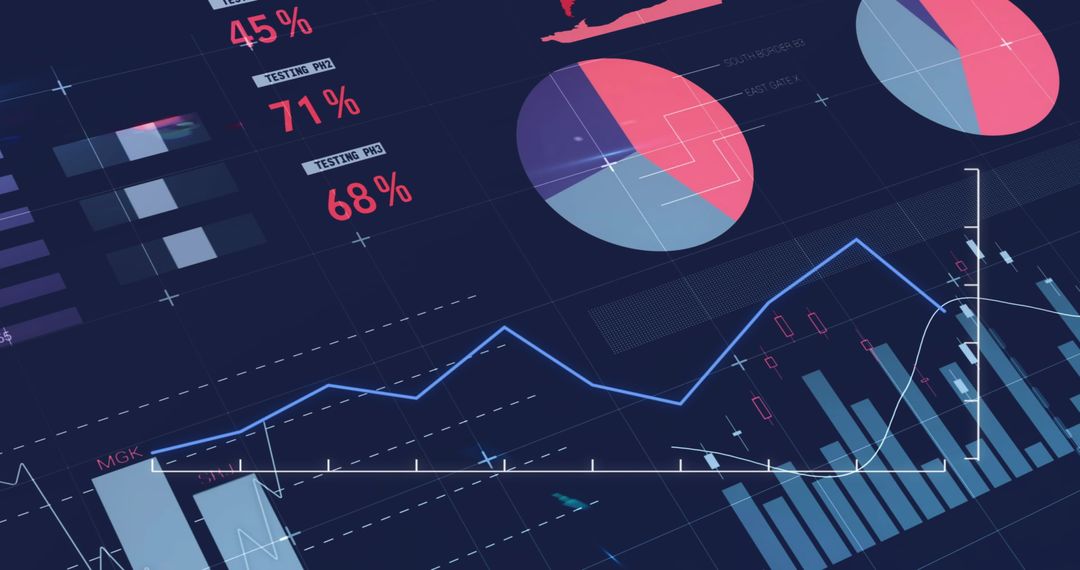
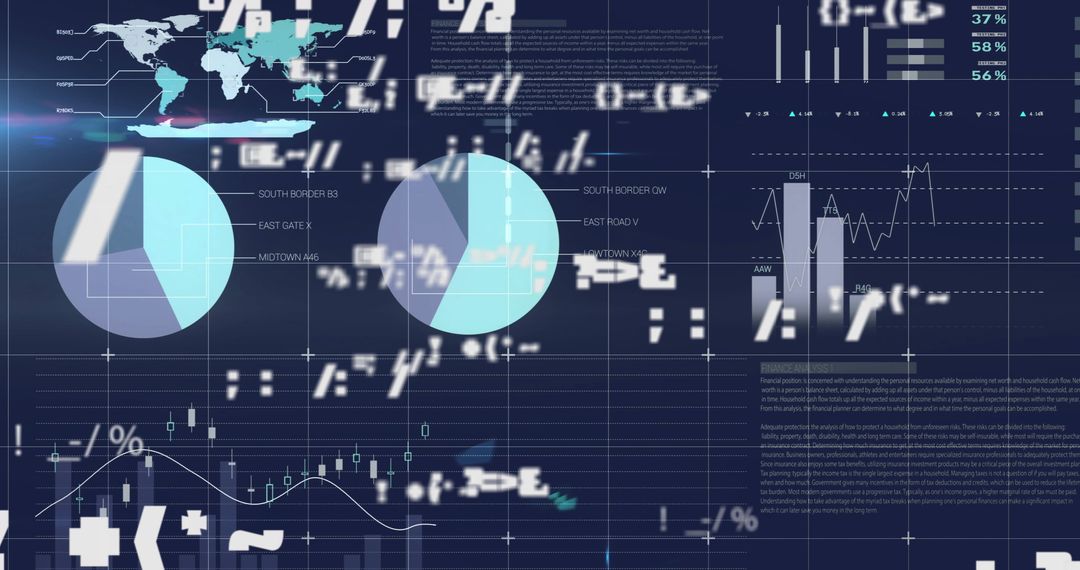
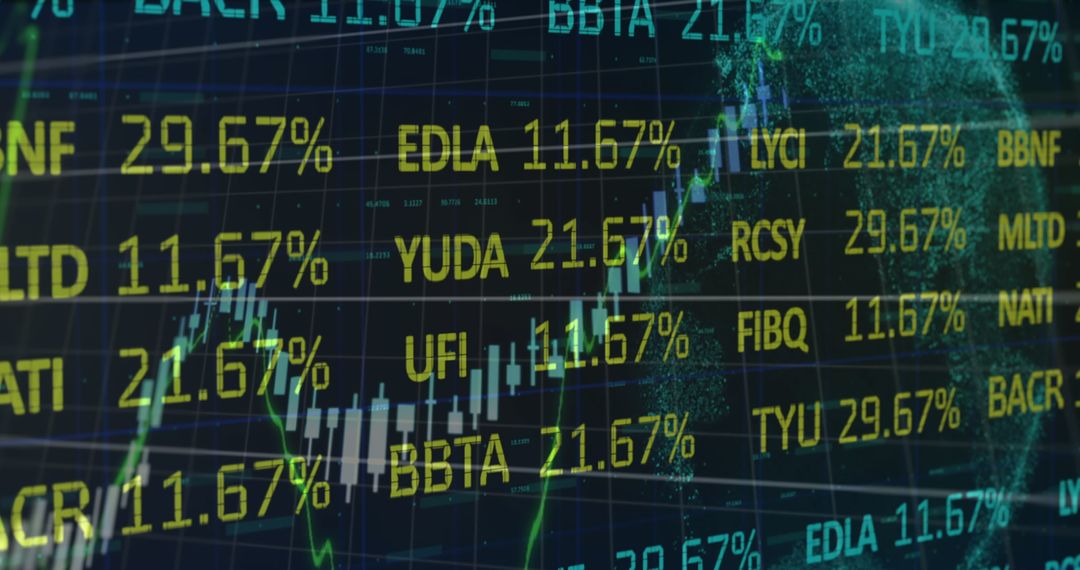
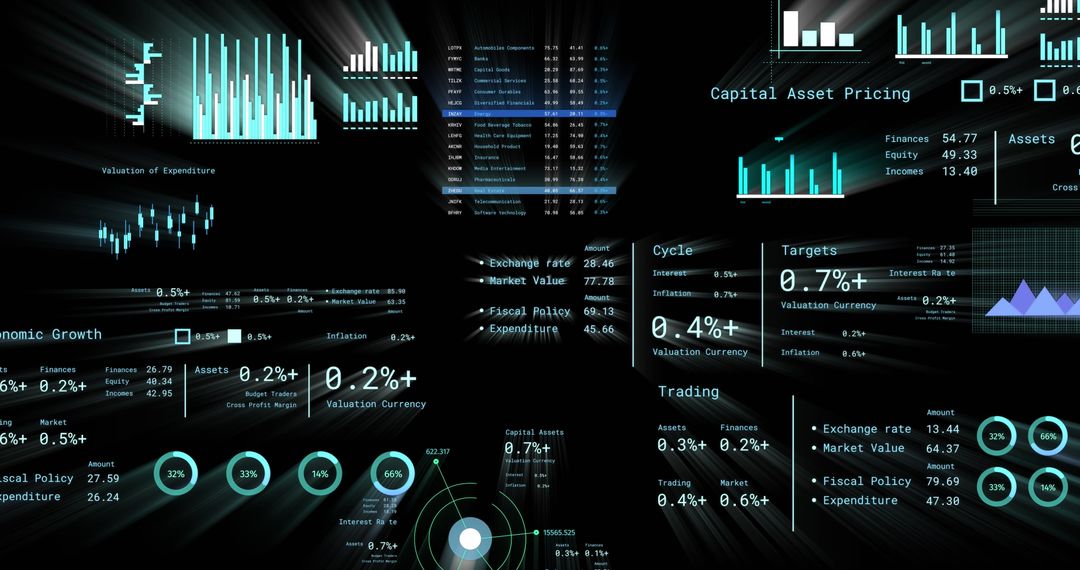
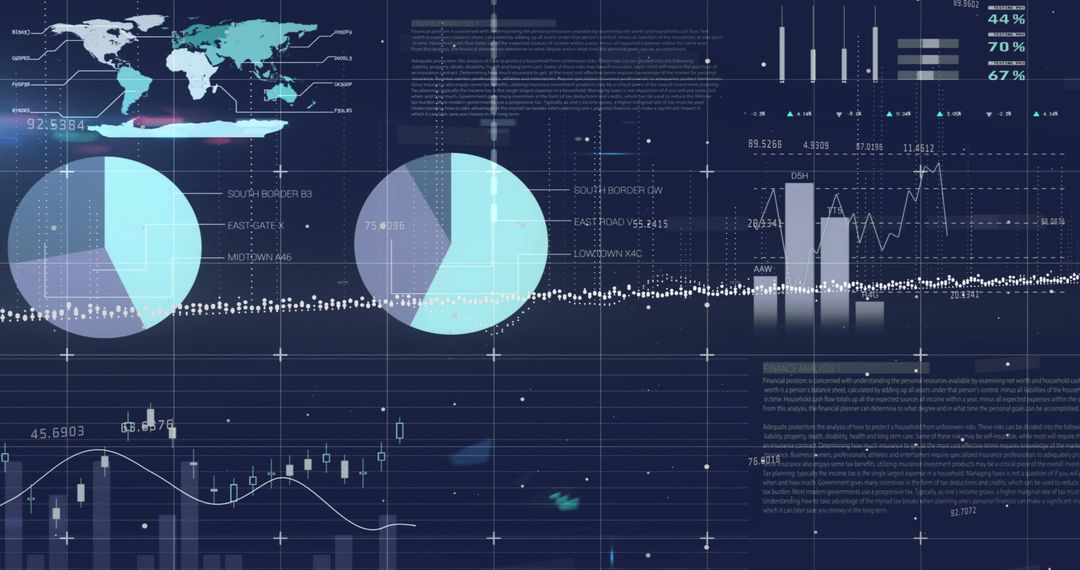
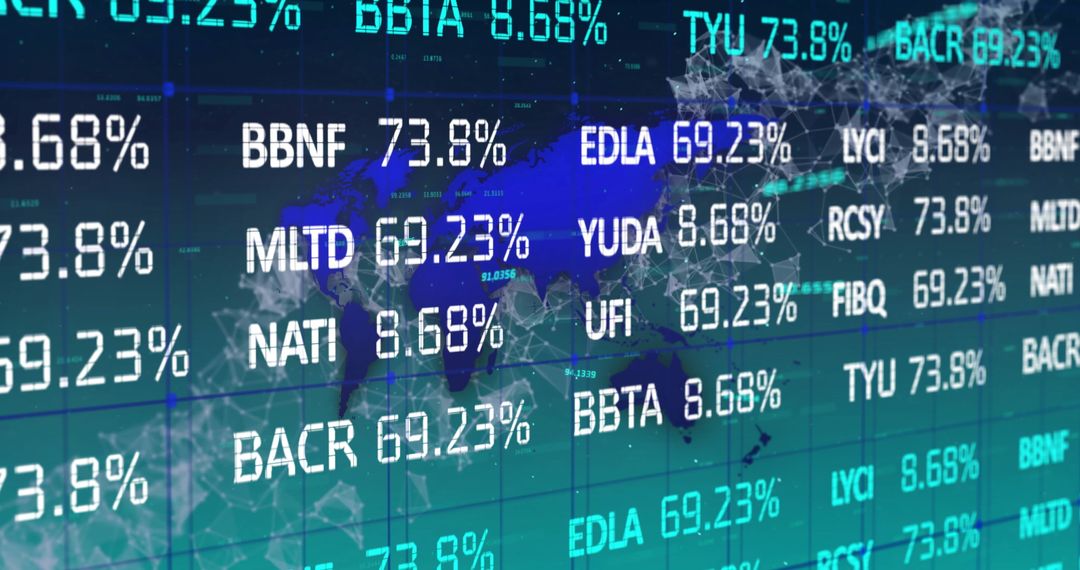
- Digital Global Finance Graphics Over World Map
Digital Global Finance Graphics Over World Map Image
Abstract design combines digital graphics of financial statistics with world map backdrop. Blue and green holographic numbers and charts create futuristic feel, suggesting real-time data analysis and global financial trends. Useful for presentations, articles, and educational materials relating to international business, finance technology, and data analytics concepts.
Powered by  - Get 15% off with code: PIKWIZARD15


2
downloads
downloads
Tags:
More
Credit Photo
If you would like to credit the Photo, here are some ways you can do so
Text Link
photo Link
<span class="text-link">
<span>
<a target="_blank" href=https://pikwizard.com/photo/digital-global-finance-graphics-over-world-map/58c9fc38deefe9db3c827b962f1b04a1/>PikWizard</a>
</span>
</span>
<span class="image-link">
<span
style="margin: 0 0 20px 0; display: inline-block; vertical-align: middle; width: 100%;"
>
<a
target="_blank"
href="https://pikwizard.com/photo/digital-global-finance-graphics-over-world-map/58c9fc38deefe9db3c827b962f1b04a1/"
style="text-decoration: none; font-size: 10px; margin: 0;"
>
<img src="https://pikwizard.com/pw/medium/58c9fc38deefe9db3c827b962f1b04a1.jpg" style="margin: 0; width: 100%;" alt="" />
<p style="font-size: 12px; margin: 0;">PikWizard</p>
</a>
</span>
</span>
Free (free of charge)
Free for personal and commercial use.
Author: Creative Art
Similar Free Stock Images

Premium


Premium


Premium


Premium


Premium


Premium


Premium


Premium


Premium


Premium


Premium


Premium


Premium


Premium


Premium


Premium


Premium


Premium


Premium


Premium


Premium


Premium


Premium


Premium