
- Home >
- Stock Photos >
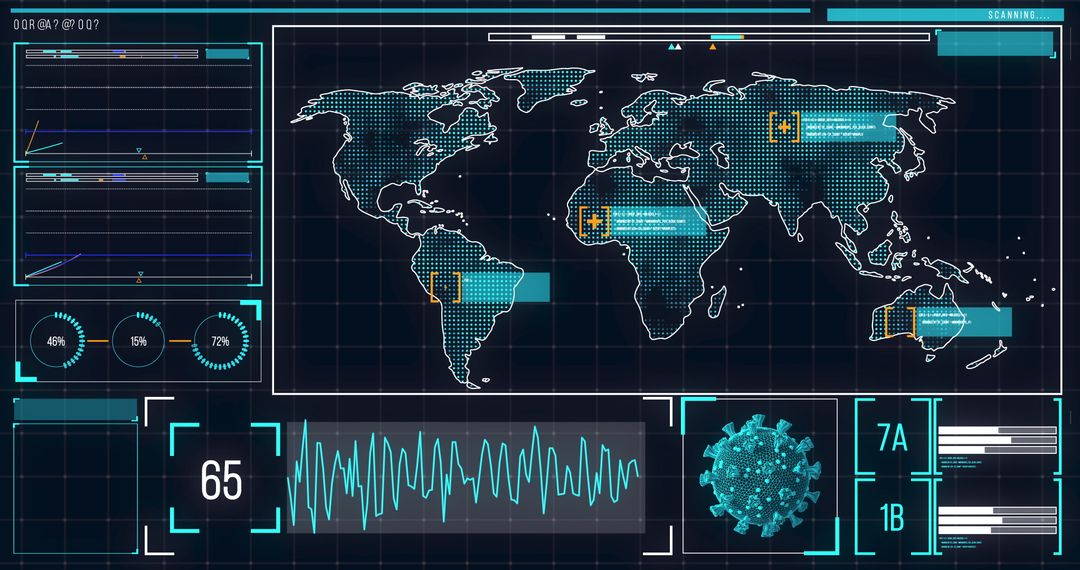
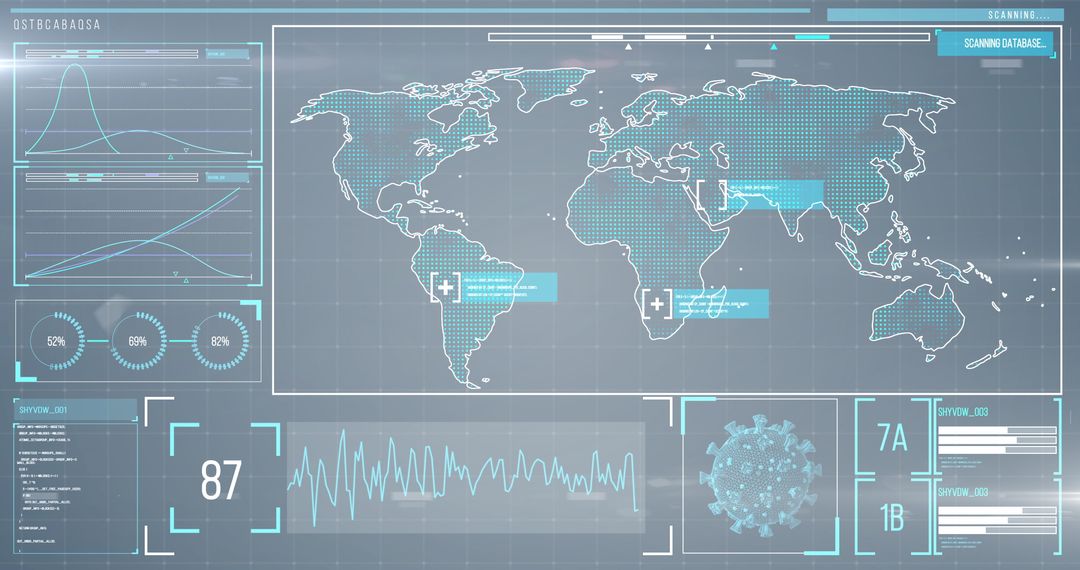
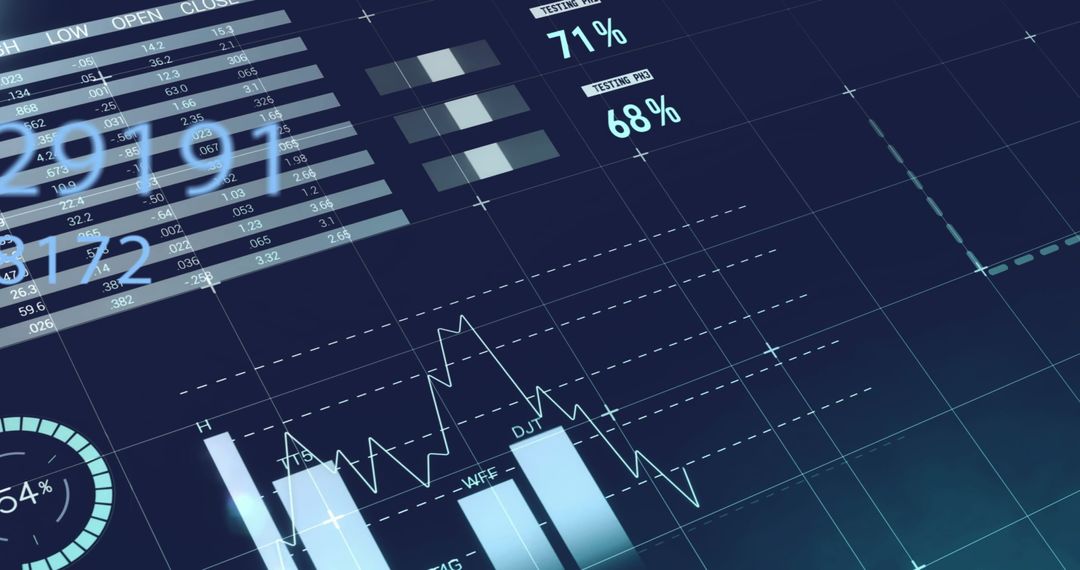
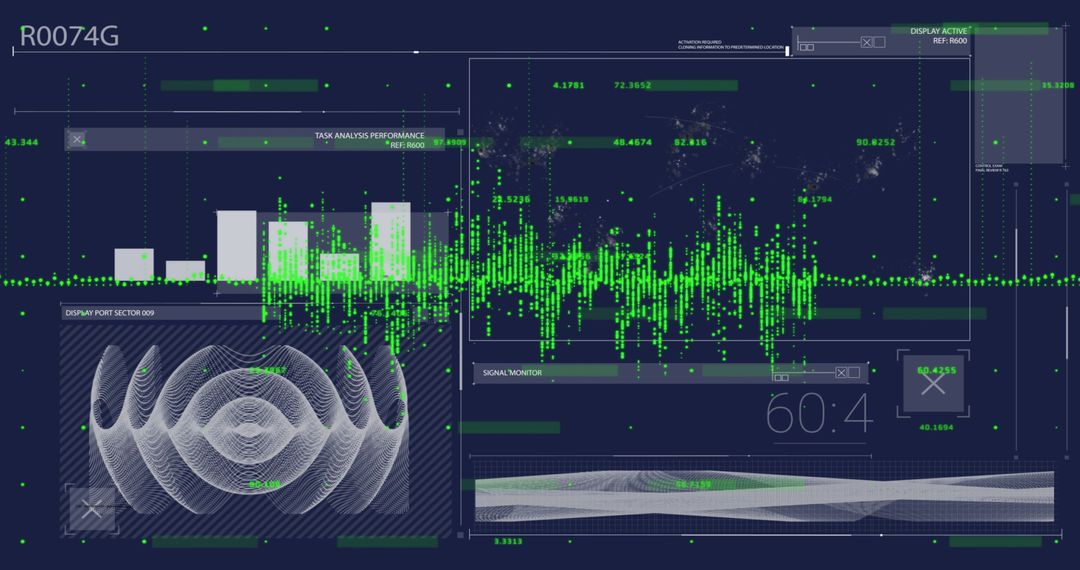
- Digital Global Finance Interface with Analytical Graphs
Digital Global Finance Interface with Analytical Graphs Image

Concept representing global finances with a digital interface featuring various graphs and charts on networked displays. Suitable for showcasing trends in data analysis, economic forecasts, or financial and business technology sectors integrated with global computing systems. Ideal for presentations on digital marketing, fintech innovations, enterprise solutions or economic research.
Powered by 


2
downloads
downloads
Tags:
More
Credit Photo
If you would like to credit the Photo, here are some ways you can do so
Text Link
photo Link
<span class="text-link">
<span>
<a target="_blank" href=https://pikwizard.com/photo/digital-global-finance-interface-with-analytical-graphs/02d6e6667ebde5da10ffc662b4f9250b/>PikWizard</a>
</span>
</span>
<span class="image-link">
<span
style="margin: 0 0 20px 0; display: inline-block; vertical-align: middle; width: 100%;"
>
<a
target="_blank"
href="https://pikwizard.com/photo/digital-global-finance-interface-with-analytical-graphs/02d6e6667ebde5da10ffc662b4f9250b/"
style="text-decoration: none; font-size: 10px; margin: 0;"
>
<img src="https://pikwizard.com/pw/medium/02d6e6667ebde5da10ffc662b4f9250b.jpg" style="margin: 0; width: 100%;" alt="" />
<p style="font-size: 12px; margin: 0;">PikWizard</p>
</a>
</span>
</span>
Free (free of charge)
Free for personal and commercial use.
Author: Awesome Content
Similar Free Stock Images

Premium


Premium


Premium


Premium


Premium


Premium


Premium


Premium


Premium


Premium


Premium


Premium


Premium


Premium


Premium


Premium


Premium


Premium


Premium


Premium


Premium


Premium


Premium


Premium

