- Home >
- Stock Photos >
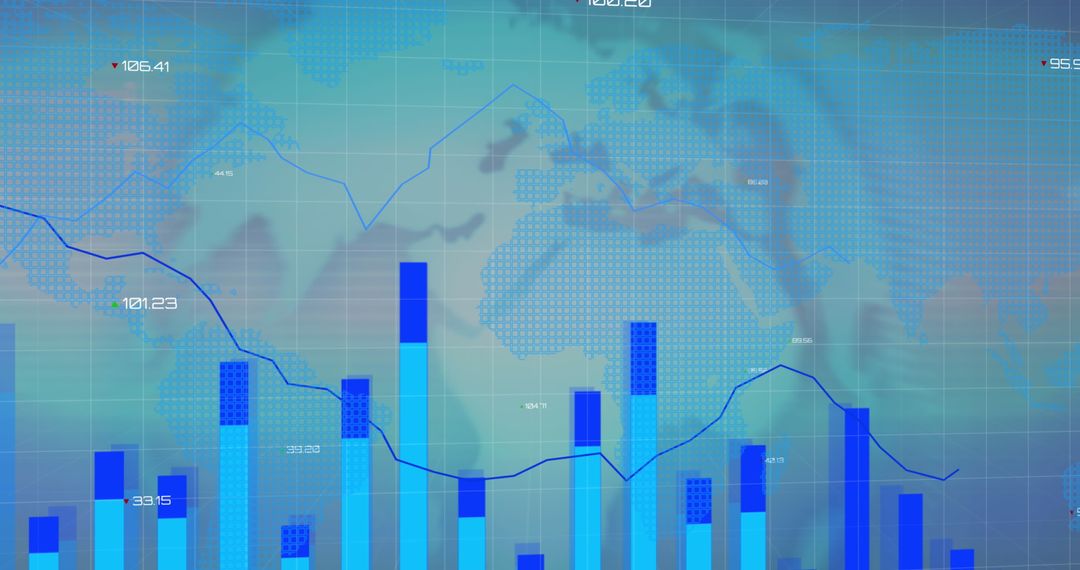
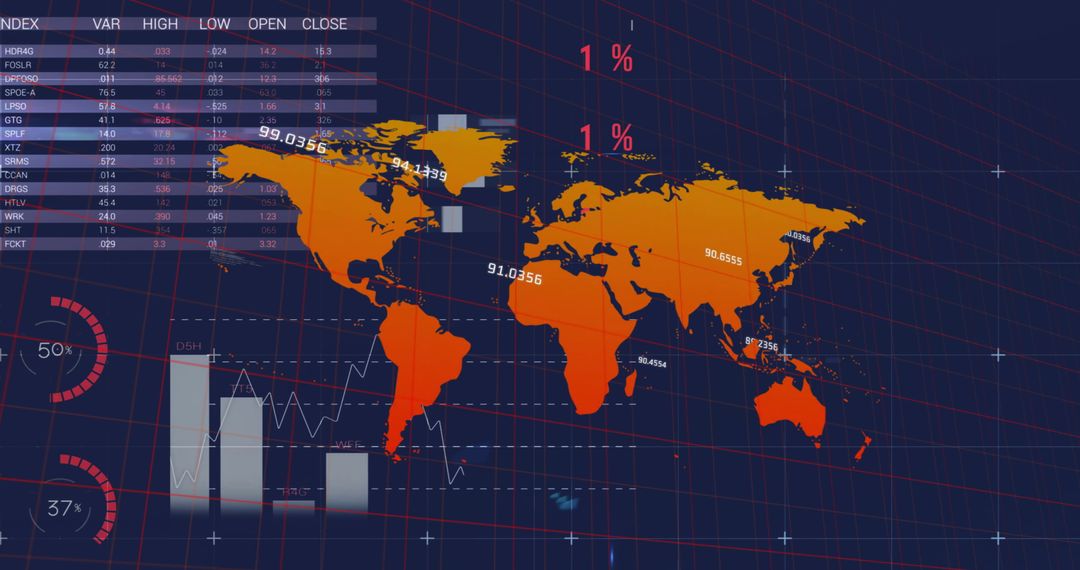
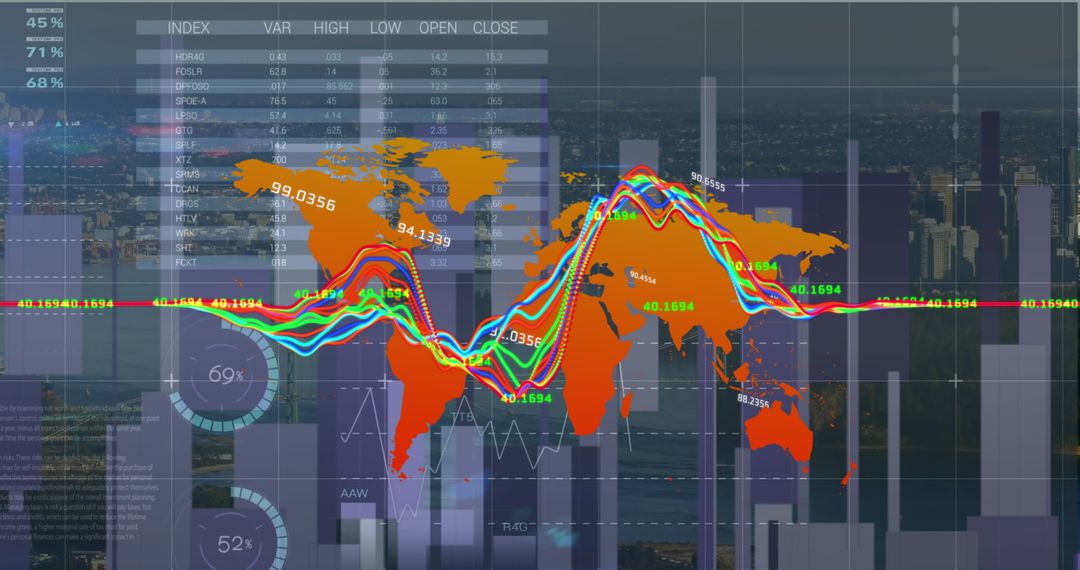
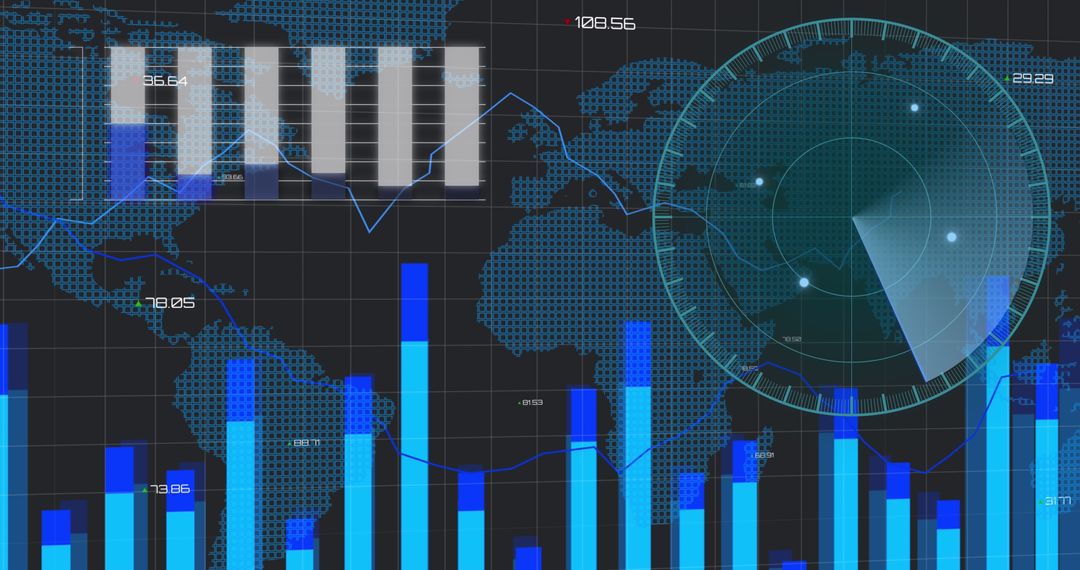
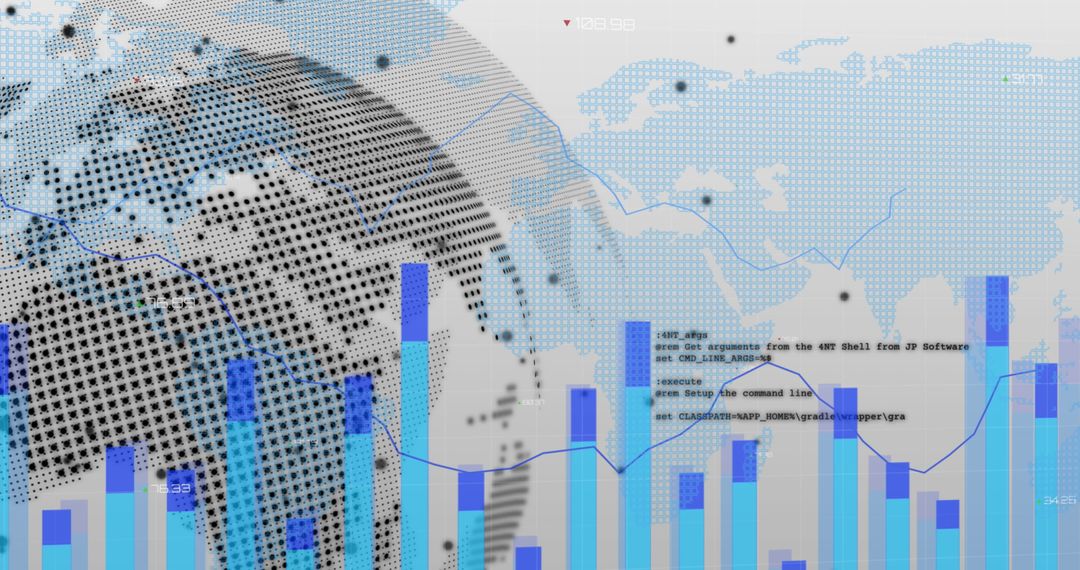
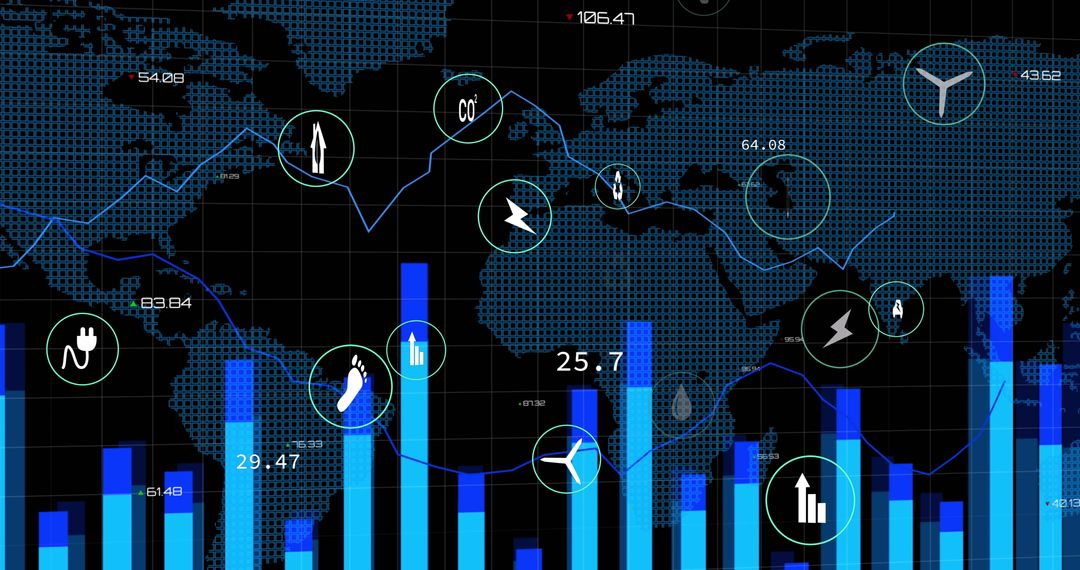
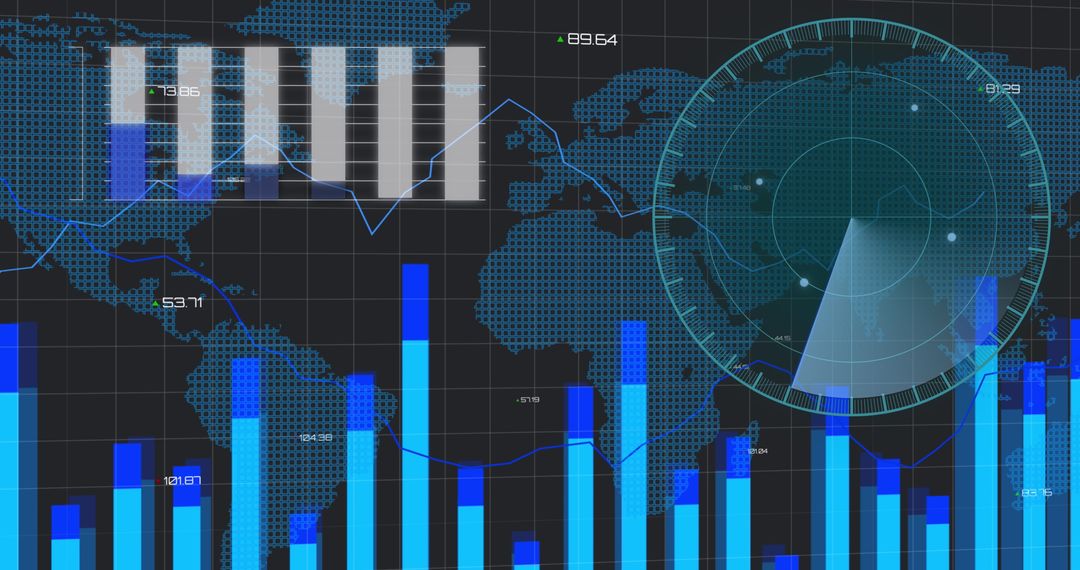
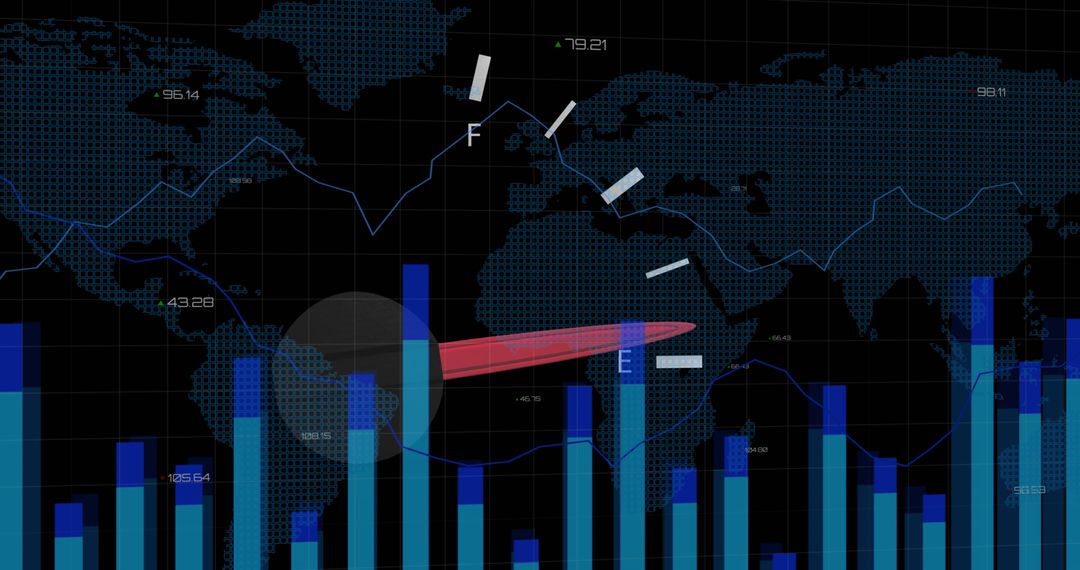
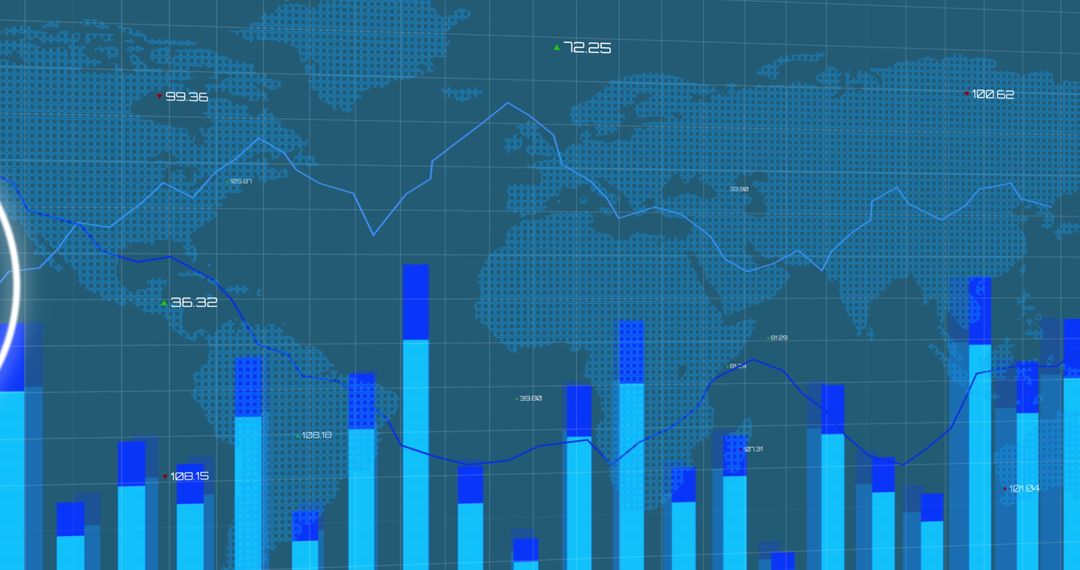
- Digital Global Map with Blue Bar Graphs and Data Analytics Overlay
Digital Global Map with Blue Bar Graphs and Data Analytics Overlay Image

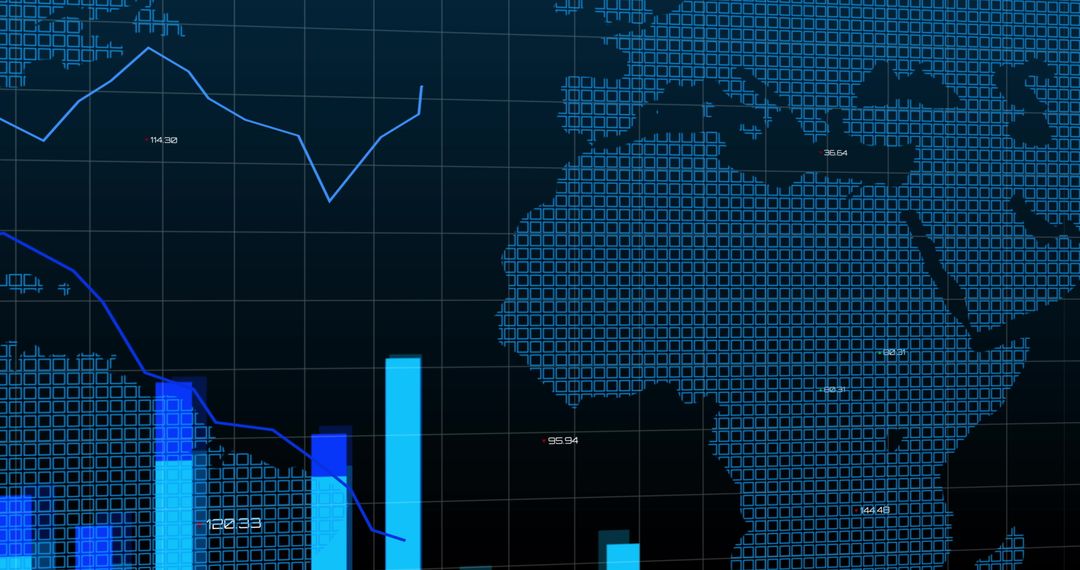
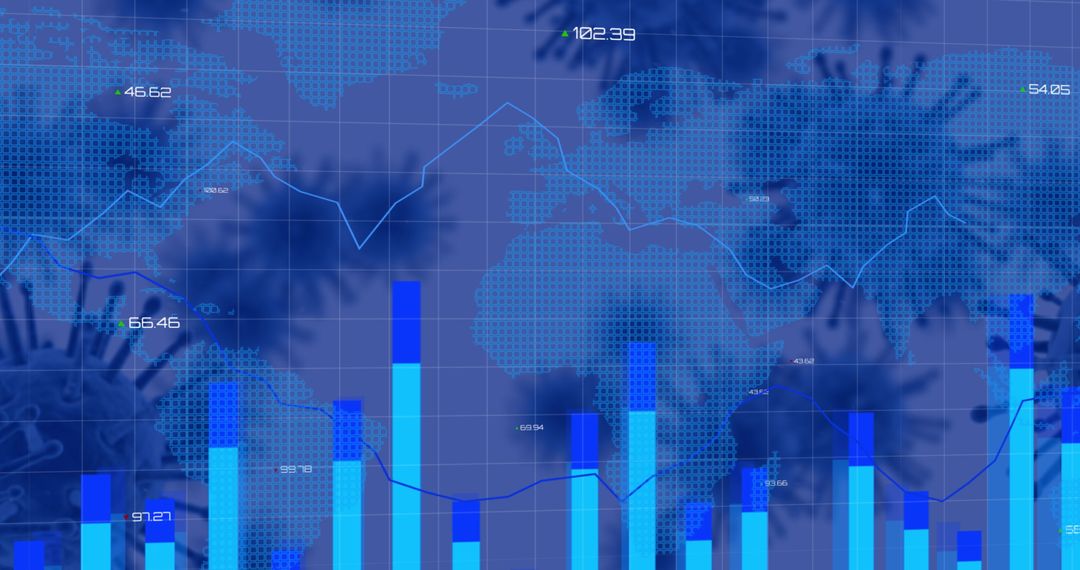
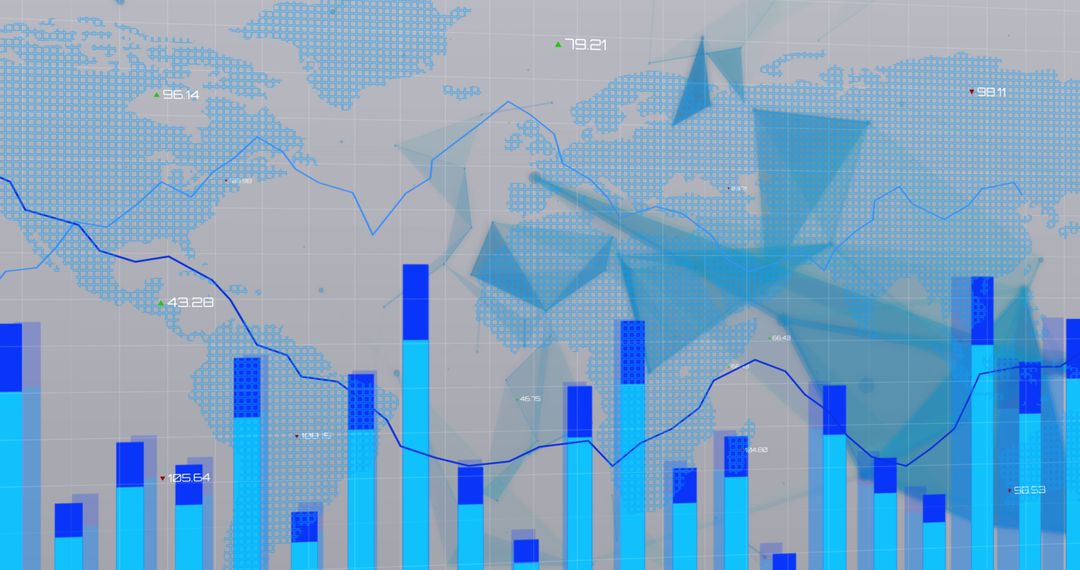
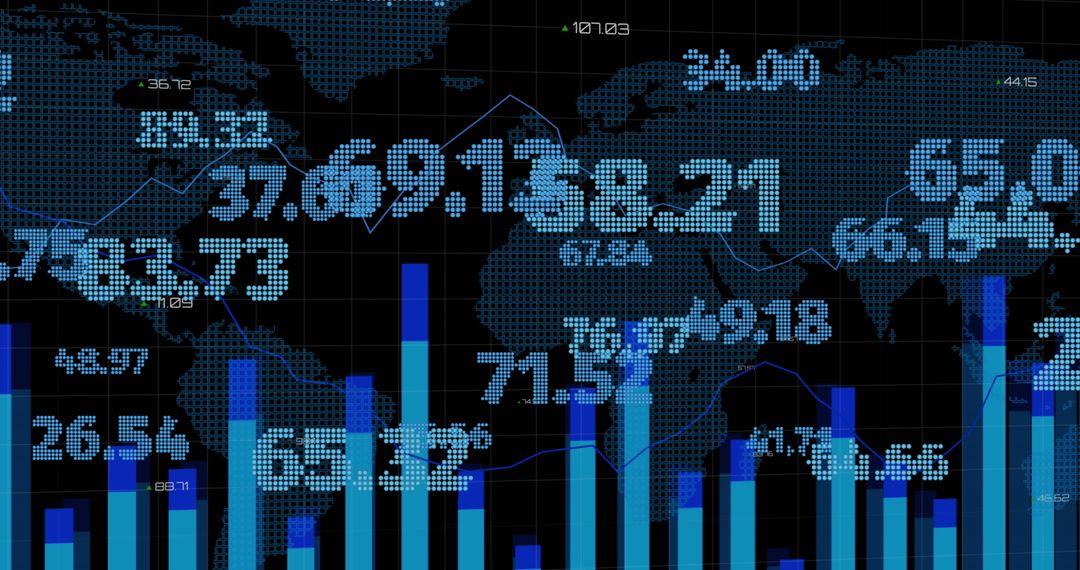
Map visualizes digital data and analytics concepts with clear emphasis on technology and innovation. Great for articles on big data, technology trends, or presentations on global business strategies and analytics.
Powered by  - Get 15% off with code: PIKWIZARD15


0
downloads
downloads
Tags:
More
Credit Photo
If you would like to credit the Photo, here are some ways you can do so
Text Link
photo Link
<span class="text-link">
<span>
<a target="_blank" href=https://pikwizard.com/photo/digital-global-map-with-blue-bar-graphs-and-data-analytics-overlay/6d39a81a5987d38294e9795325303c8b/>PikWizard</a>
</span>
</span>
<span class="image-link">
<span
style="margin: 0 0 20px 0; display: inline-block; vertical-align: middle; width: 100%;"
>
<a
target="_blank"
href="https://pikwizard.com/photo/digital-global-map-with-blue-bar-graphs-and-data-analytics-overlay/6d39a81a5987d38294e9795325303c8b/"
style="text-decoration: none; font-size: 10px; margin: 0;"
>
<img src="https://pikwizard.com/pw/medium/6d39a81a5987d38294e9795325303c8b.jpg" style="margin: 0; width: 100%;" alt="" />
<p style="font-size: 12px; margin: 0;">PikWizard</p>
</a>
</span>
</span>
Free (free of charge)
Free for personal and commercial use.
Author: Authentic Images
Similar Free Stock Images
Premium


Premium


Premium


Premium


Premium


Premium


Premium


Premium


Premium


Premium


Premium


Premium


Premium


Premium


Premium


Premium


Premium


Premium


Premium


Premium


Premium


Premium


Premium


Premium