
- Home >
- Stock Photos >
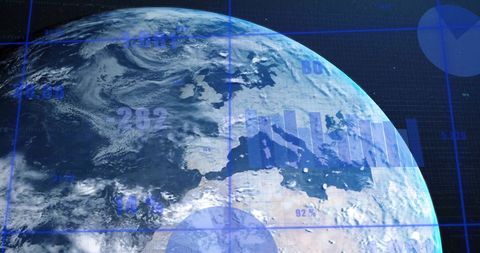
- Digital Globe on Futuristic Data Analytics Interface
Digital Globe on Futuristic Data Analytics Interface Image

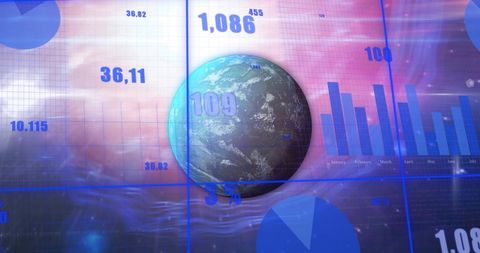
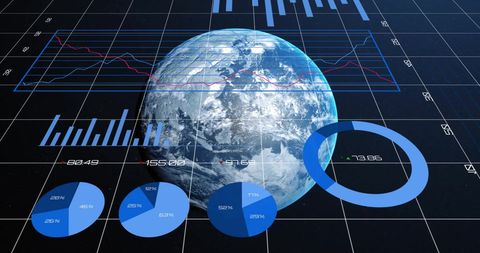
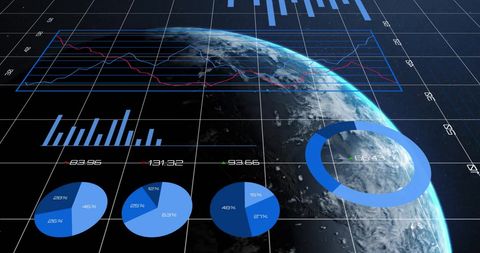
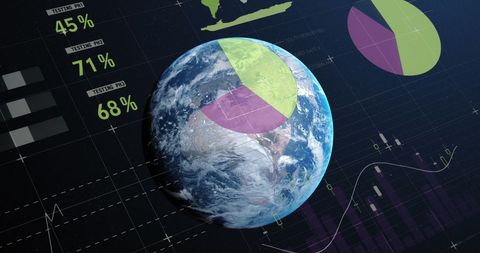
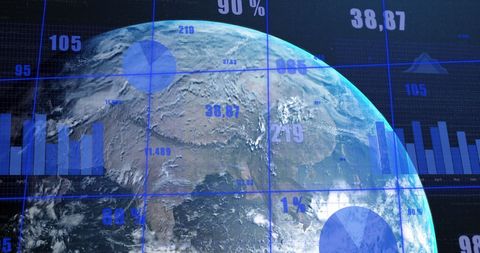
This digital representation of a 3D globe surrounded by numeric data and charts on a futuristic interface could be an ideal choice for illustrating topics related to global data analytics and technology trends. It visually communicates themes of innovation, global connectivity, and the integration of technology in analyzing vast amounts of data. Suitable for use in technology blogs, financial analysis presentations, and educational resources focusing on digital transformation.
Powered by 


downloads
Tags:
More
Credit Photo
If you would like to credit the Photo, here are some ways you can do so
Text Link
photo Link
<span class="text-link">
<span>
<a target="_blank" href=https://pikwizard.com/photo/digital-globe-on-futuristic-data-analytics-interface/2b3572d9275b71ba5090acd6e04d1a21/>PikWizard</a>
</span>
</span>
<span class="image-link">
<span
style="margin: 0 0 20px 0; display: inline-block; vertical-align: middle; width: 100%;"
>
<a
target="_blank"
href="https://pikwizard.com/photo/digital-globe-on-futuristic-data-analytics-interface/2b3572d9275b71ba5090acd6e04d1a21/"
style="text-decoration: none; font-size: 10px; margin: 0;"
>
<img src="https://pikwizard.com/pw/medium/2b3572d9275b71ba5090acd6e04d1a21.jpg" style="margin: 0; width: 100%;" alt="" />
<p style="font-size: 12px; margin: 0;">PikWizard</p>
</a>
</span>
</span>
Free (free of charge)
Free for personal and commercial use.
Author: People Creations
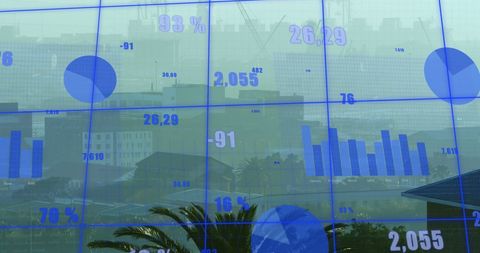
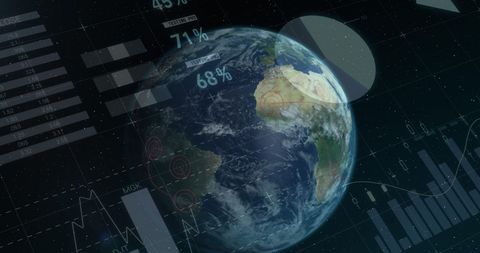
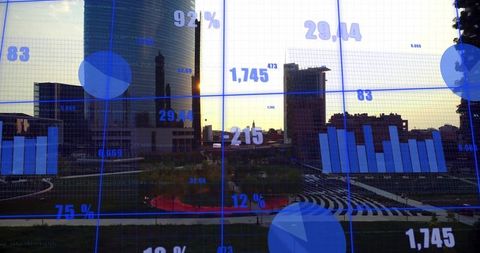
Similar Free Stock Images

Premium


Premium


Premium


Premium


Premium


Premium

Premium

Premium


Premium


Premium


Premium


Premium


Premium

Premium

Premium


Premium


Premium


Premium


Premium


Premium


Premium


Premium


Premium


Premium


Premium

Explore More Free Stock Images