- Home >
- Stock Photos >
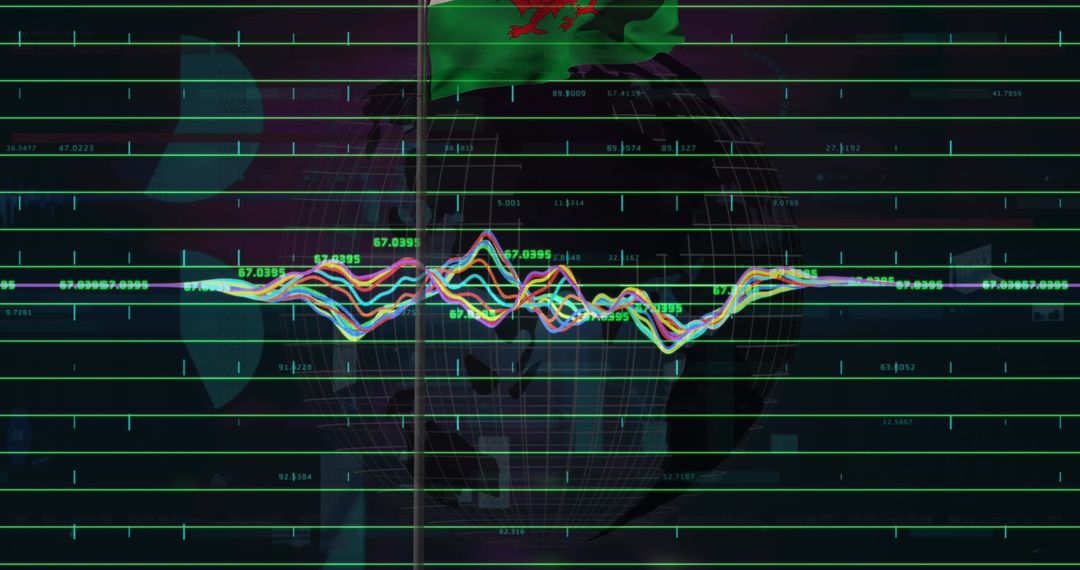
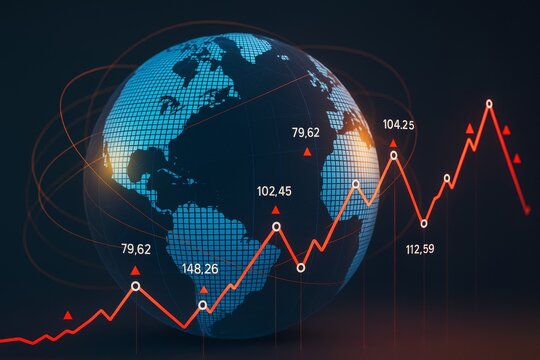
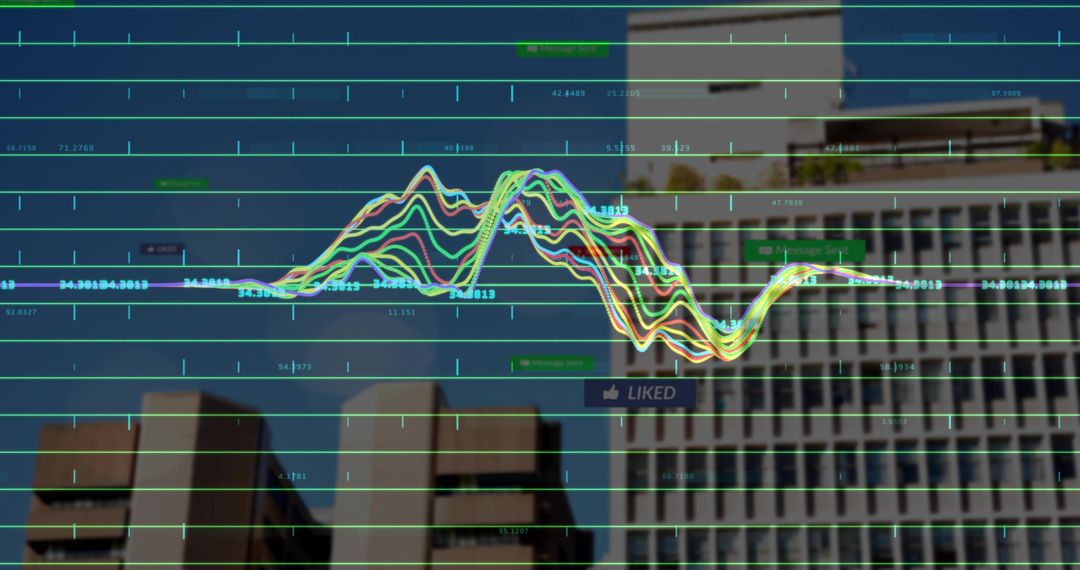
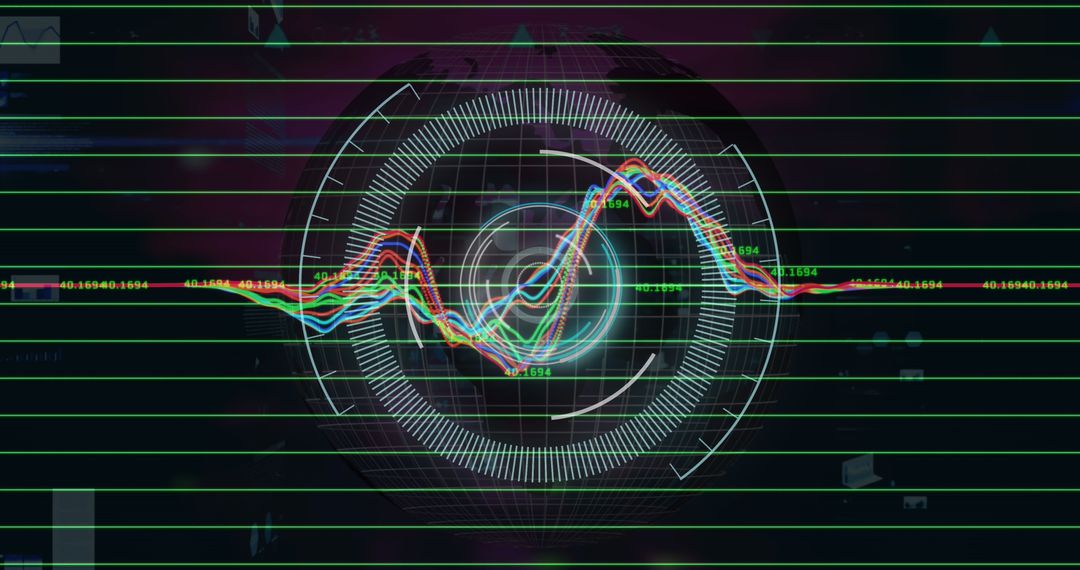
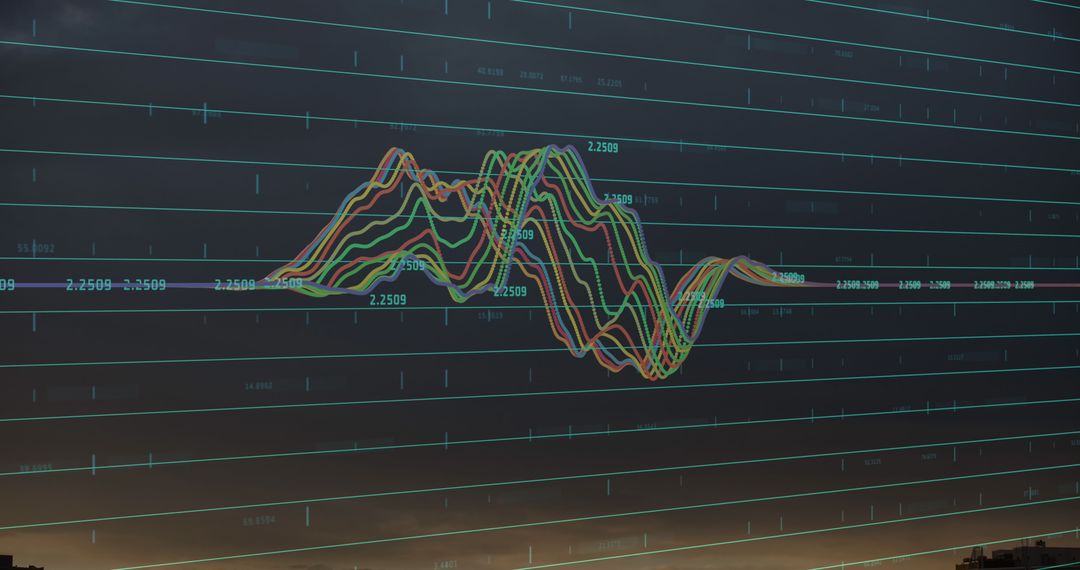
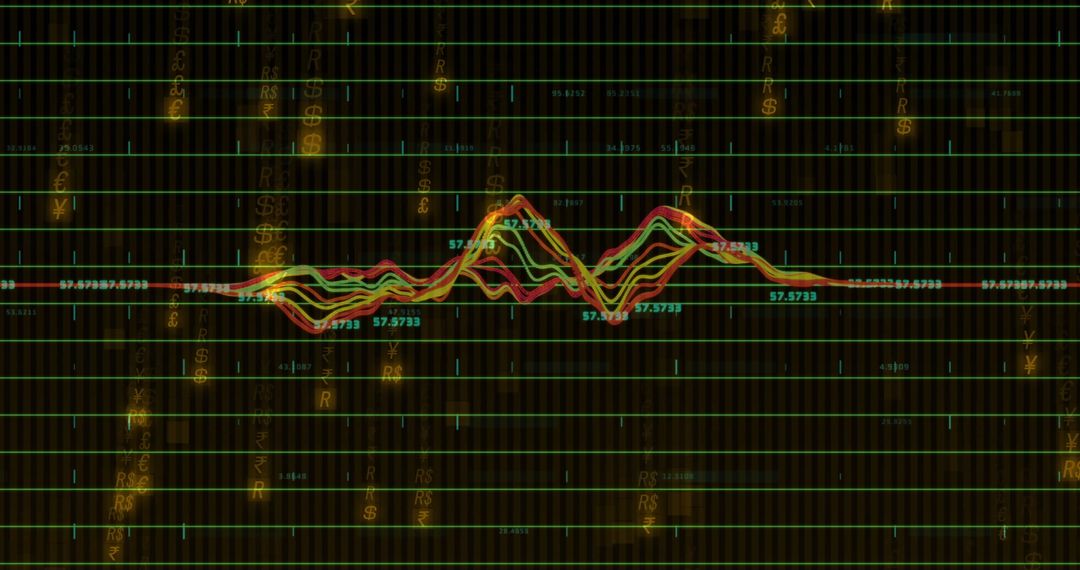
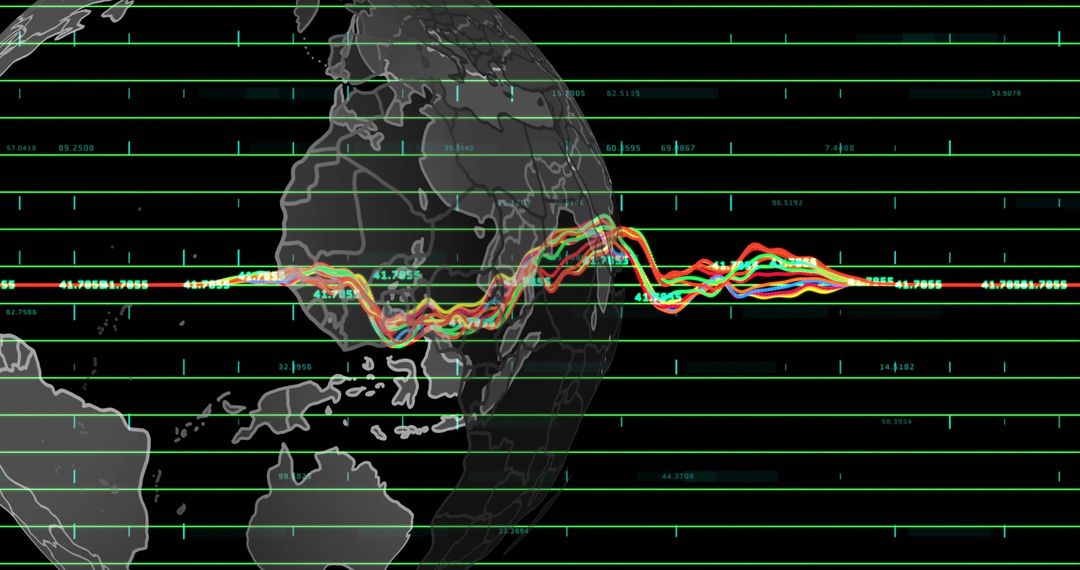
- Digital Globe with Intersecting Graphs Representing Global Economy
Digital Globe with Intersecting Graphs Representing Global Economy Image

This digital illustration combines a visually stylized globe with overlaid graphs, representing global finance and economic trends. It emphasizes technology's role in modern economic analysis and is ideal for use in presentations, financial reports, and online platforms focusing on global economic studies or technology in finance. Designers can use it to symbolize interconnectedness in world economics and technological advancement.
Powered by 


2
downloads
downloads
Tags:
More
Credit Photo
If you would like to credit the Photo, here are some ways you can do so
Text Link
photo Link
<span class="text-link">
<span>
<a target="_blank" href=https://pikwizard.com/photo/digital-globe-with-intersecting-graphs-representing-global-economy/31dc2610c3472a64ab483e6f6ecfe4c4/>PikWizard</a>
</span>
</span>
<span class="image-link">
<span
style="margin: 0 0 20px 0; display: inline-block; vertical-align: middle; width: 100%;"
>
<a
target="_blank"
href="https://pikwizard.com/photo/digital-globe-with-intersecting-graphs-representing-global-economy/31dc2610c3472a64ab483e6f6ecfe4c4/"
style="text-decoration: none; font-size: 10px; margin: 0;"
>
<img src="https://pikwizard.com/pw/medium/31dc2610c3472a64ab483e6f6ecfe4c4.jpg" style="margin: 0; width: 100%;" alt="" />
<p style="font-size: 12px; margin: 0;">PikWizard</p>
</a>
</span>
</span>
Free (free of charge)
Free for personal and commercial use.
Author: Authentic Images
Similar Free Stock Images

Premium


Premium


Premium


Premium


Premium


Premium


Premium


Premium


Premium


Premium


Premium


Premium


Premium


Premium


Premium


Premium


Premium


Premium


Premium


Premium


Premium


Premium


Premium


Premium