- Home >
- Stock Photos >
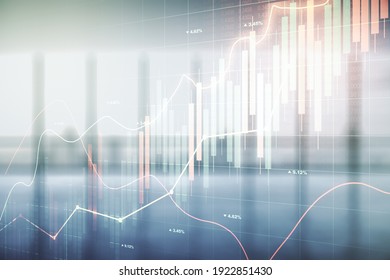
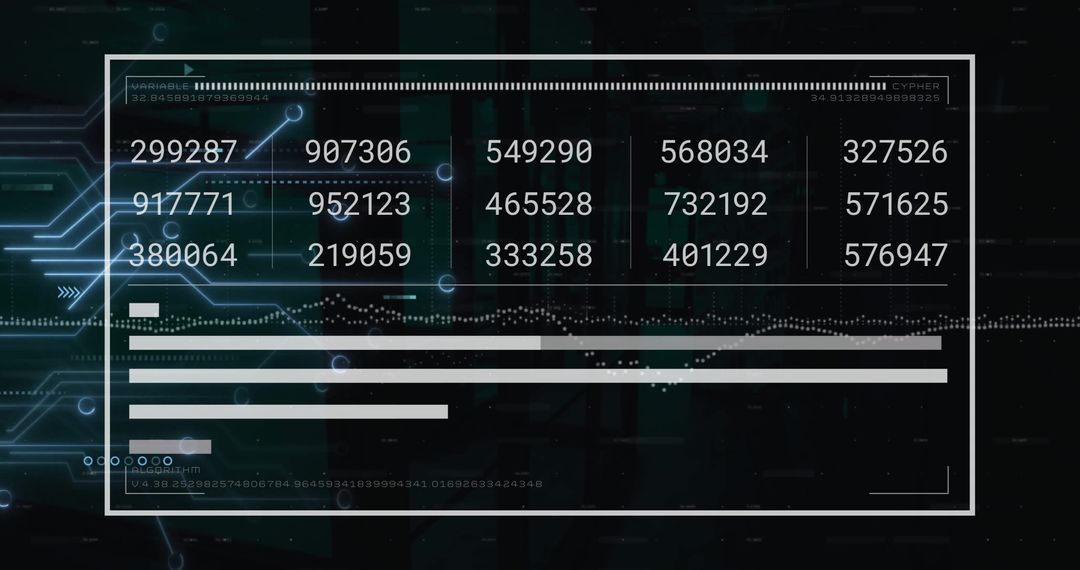
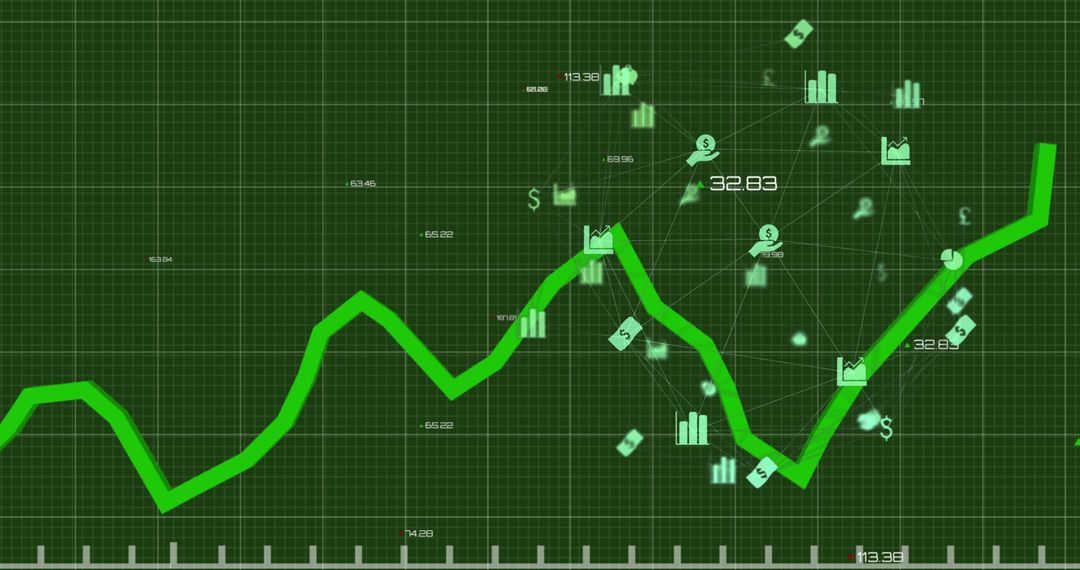
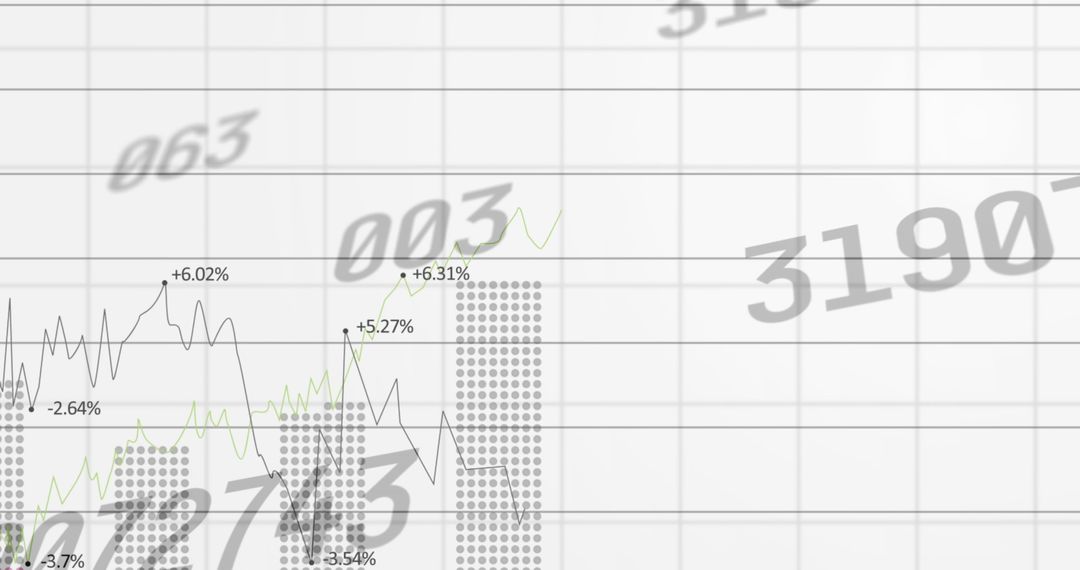
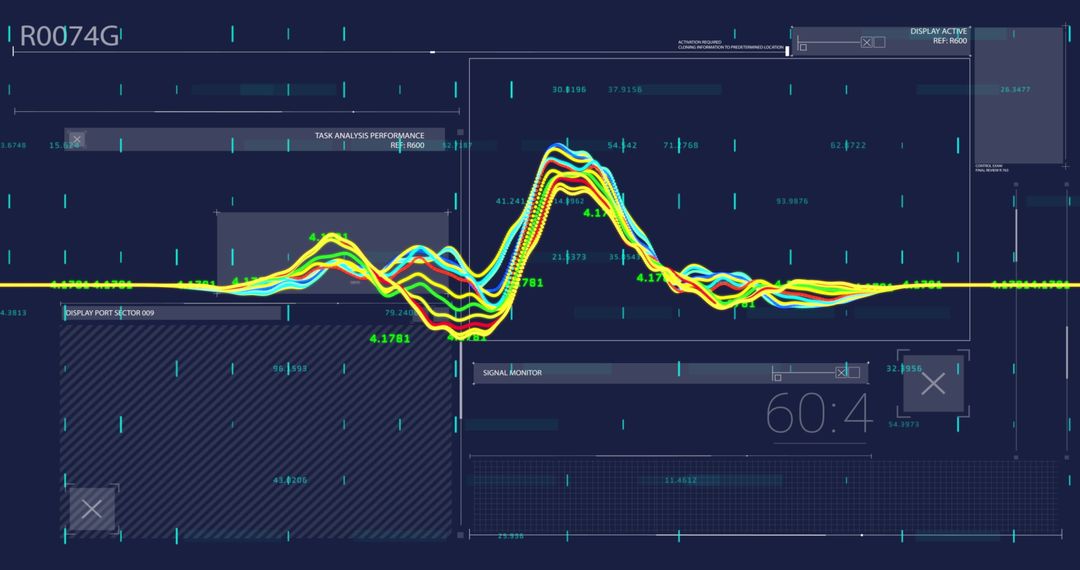
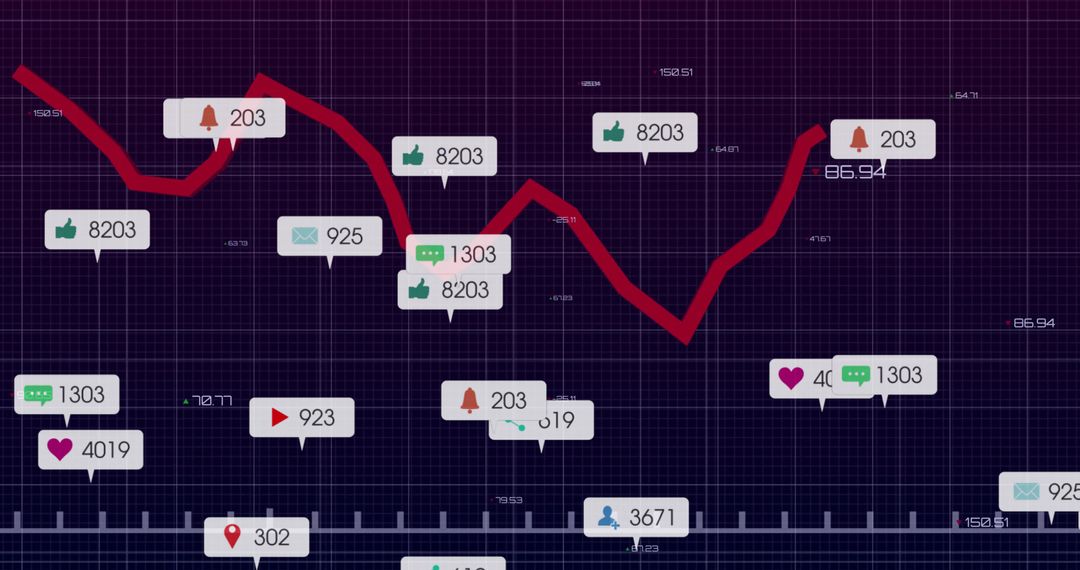
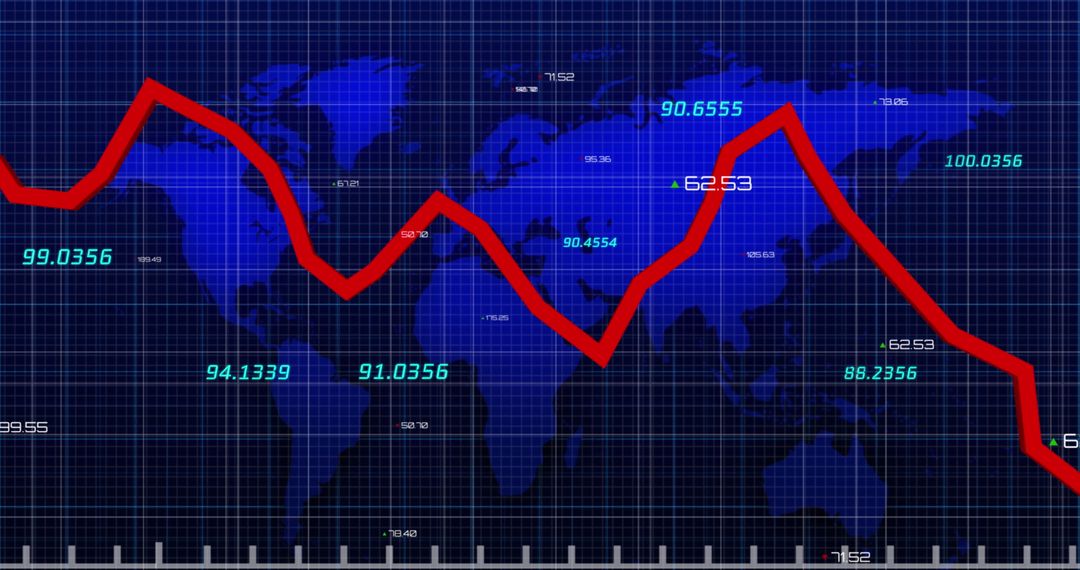
- Digital Graph and Analysis with Financial Data and Numbers
Digital Graph and Analysis with Financial Data and Numbers Image
Visual displays financial data with digital interface, emphasizing analytical processes and trends. Ideal for materials focusing on global business, fiscal studies, technological finance tools, or economic reporting.
Powered by  - Get 15% off with code: PIKWIZARD15


0
downloads
downloads
Tags:
More
Credit Photo
If you would like to credit the Photo, here are some ways you can do so
Text Link
photo Link
<span class="text-link">
<span>
<a target="_blank" href=https://pikwizard.com/photo/digital-graph-and-analysis-with-financial-data-and-numbers/a39cf718c14be24af881405844ef52ef/>PikWizard</a>
</span>
</span>
<span class="image-link">
<span
style="margin: 0 0 20px 0; display: inline-block; vertical-align: middle; width: 100%;"
>
<a
target="_blank"
href="https://pikwizard.com/photo/digital-graph-and-analysis-with-financial-data-and-numbers/a39cf718c14be24af881405844ef52ef/"
style="text-decoration: none; font-size: 10px; margin: 0;"
>
<img src="https://pikwizard.com/pw/medium/a39cf718c14be24af881405844ef52ef.jpg" style="margin: 0; width: 100%;" alt="" />
<p style="font-size: 12px; margin: 0;">PikWizard</p>
</a>
</span>
</span>
Free (free of charge)
Free for personal and commercial use.
Author: People Creations
Similar Free Stock Images

Premium


Premium


Premium


Premium


Premium


Premium


Premium


Premium


Premium


Premium


Premium


Premium


Premium


Premium


Premium


Premium


Premium


Premium


Premium


Premium


Premium


Premium


Premium


Premium