- Home >
- Stock Photos >
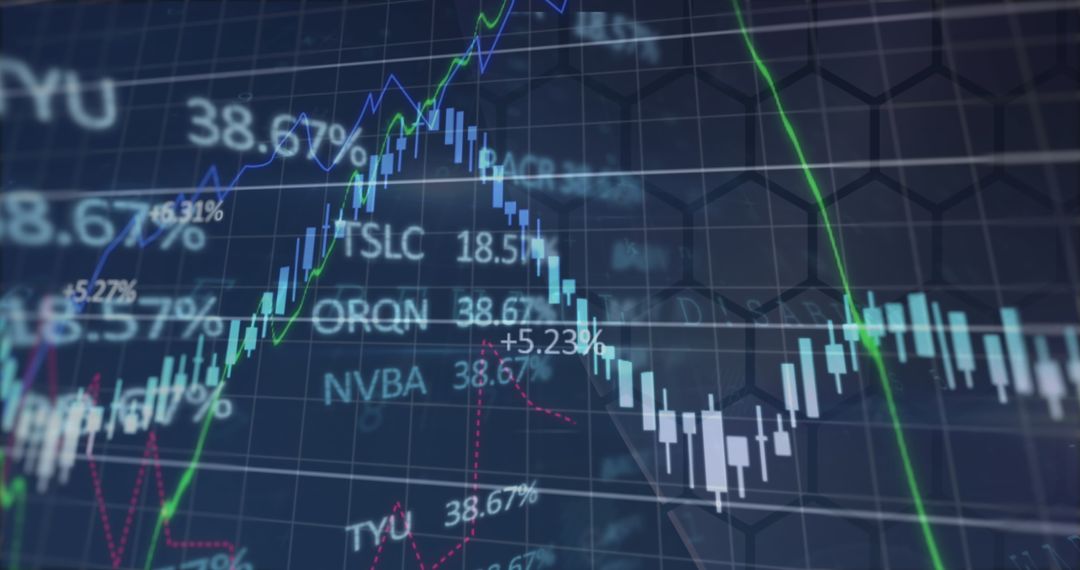
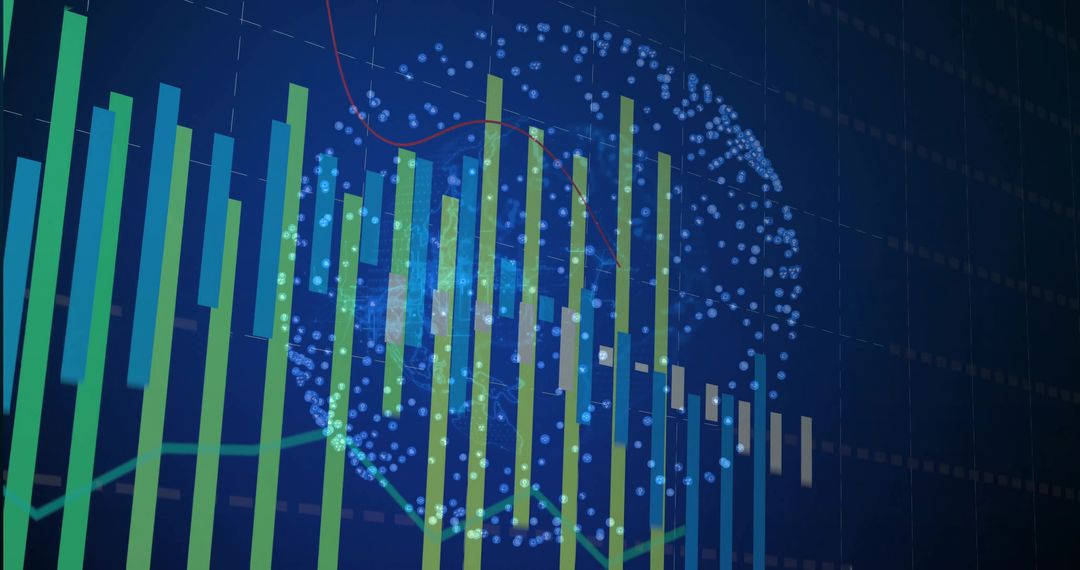
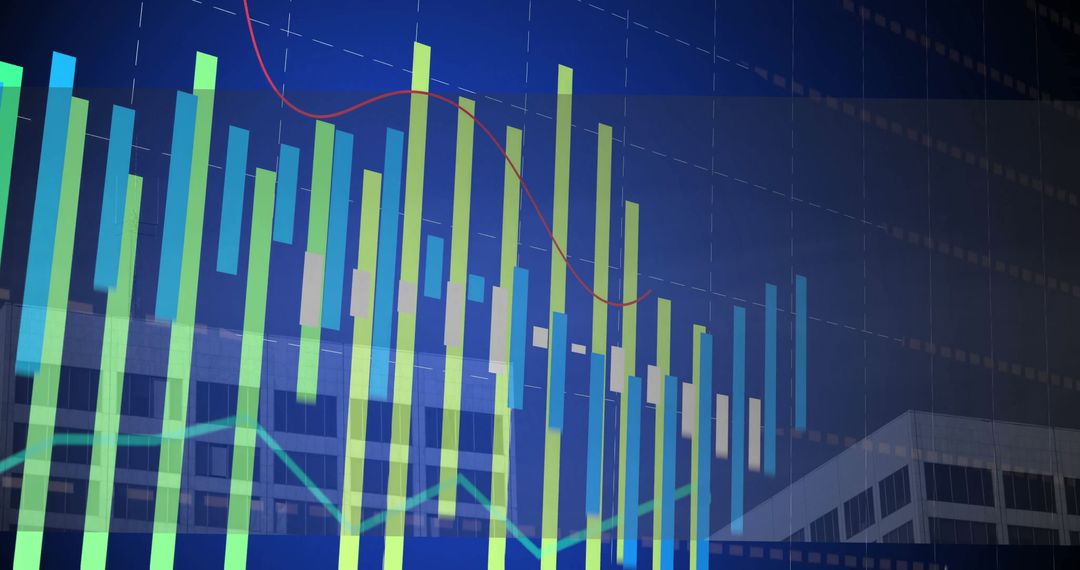
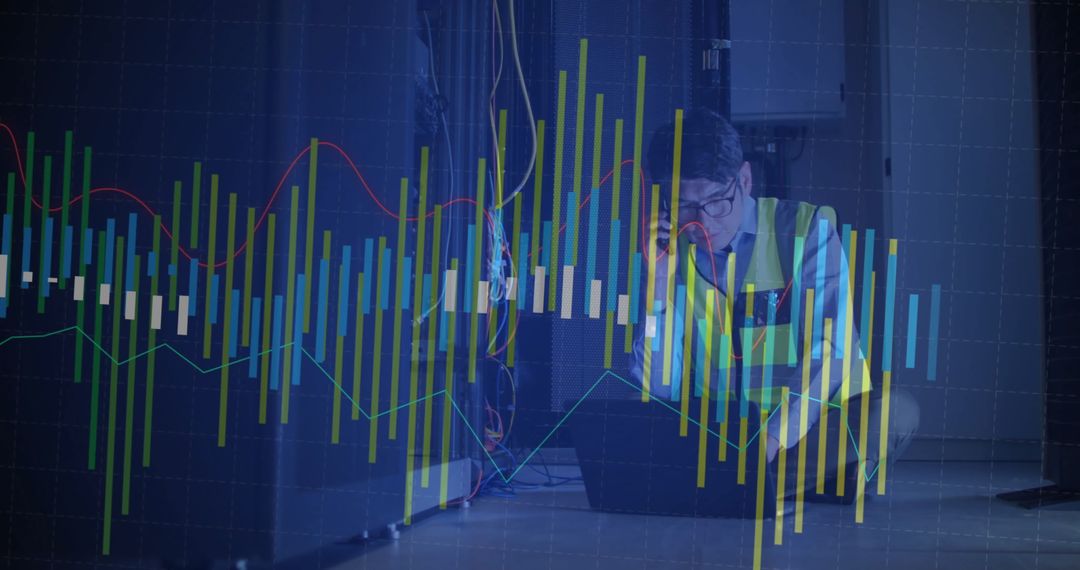
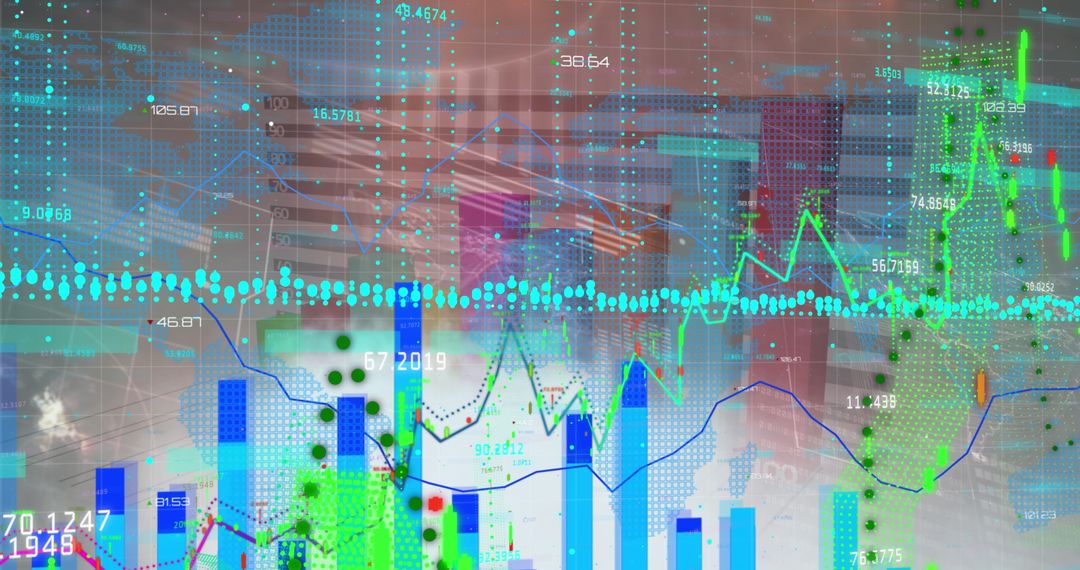
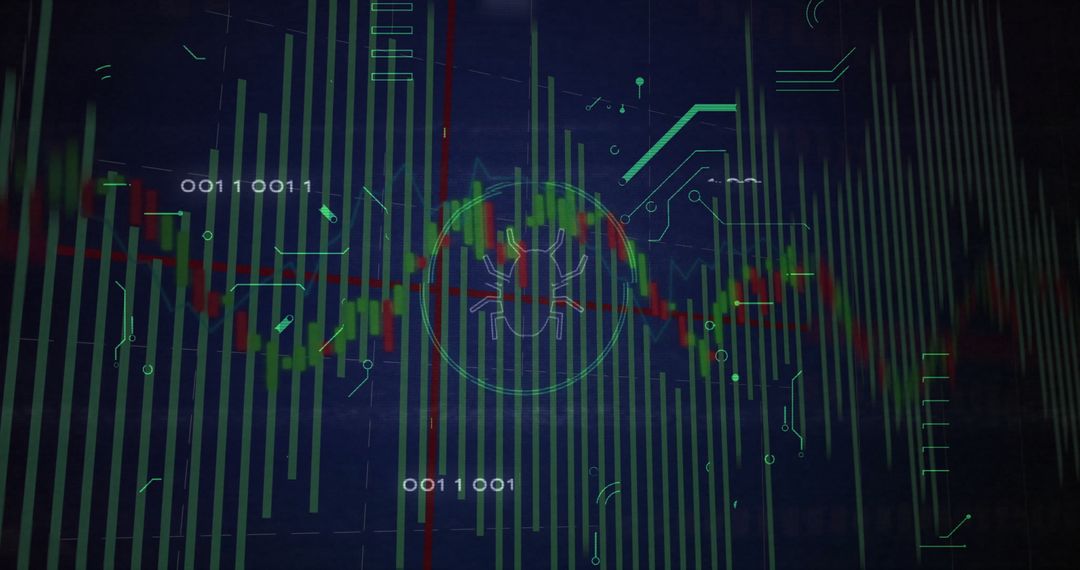
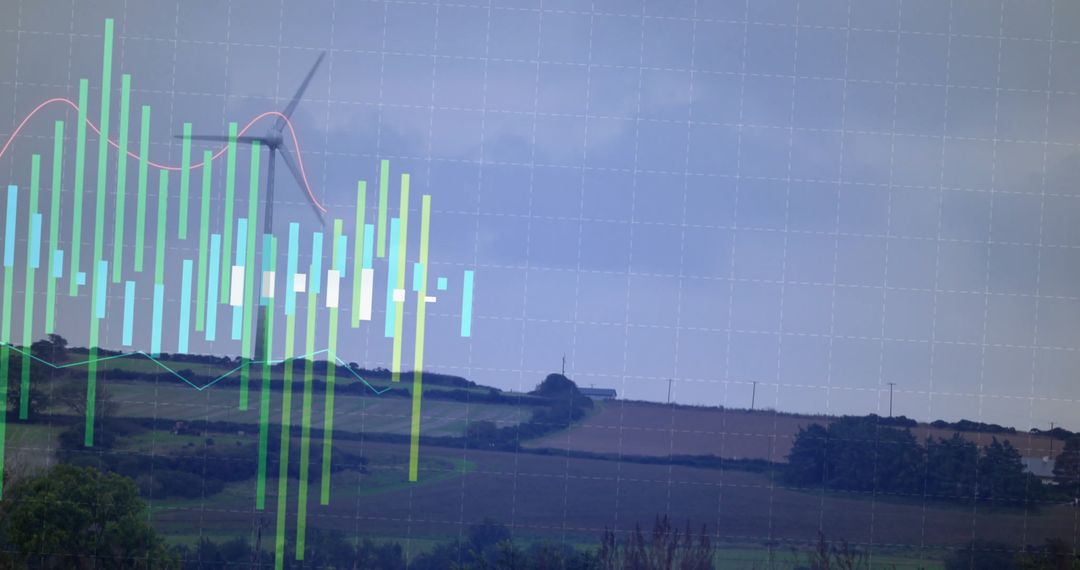
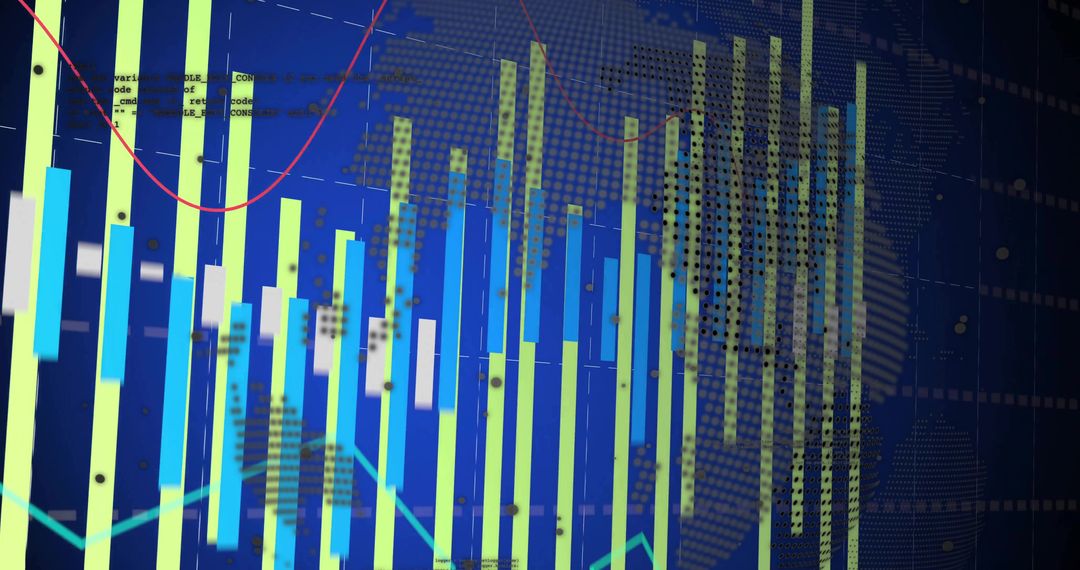
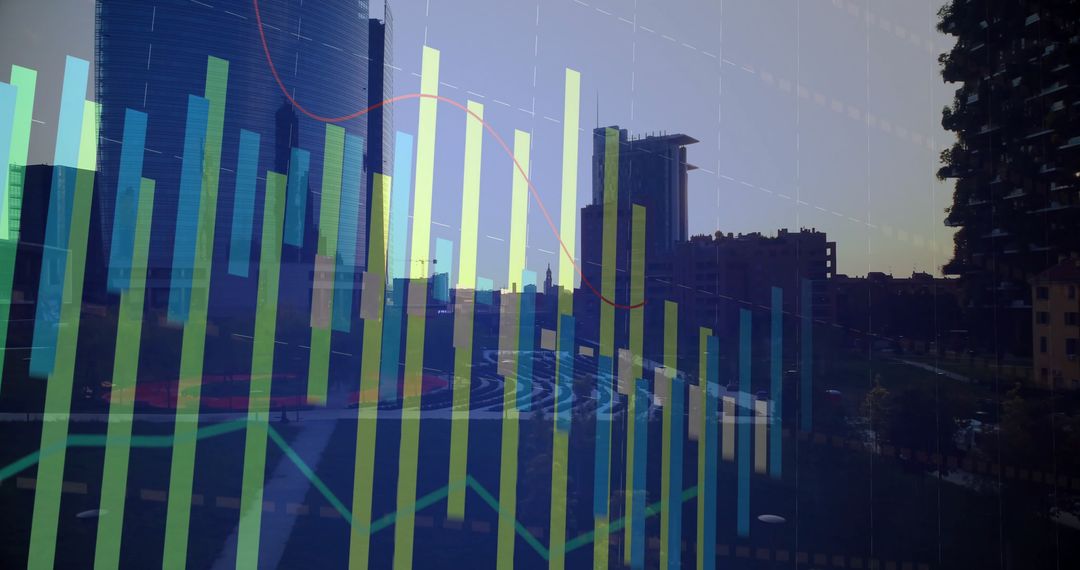
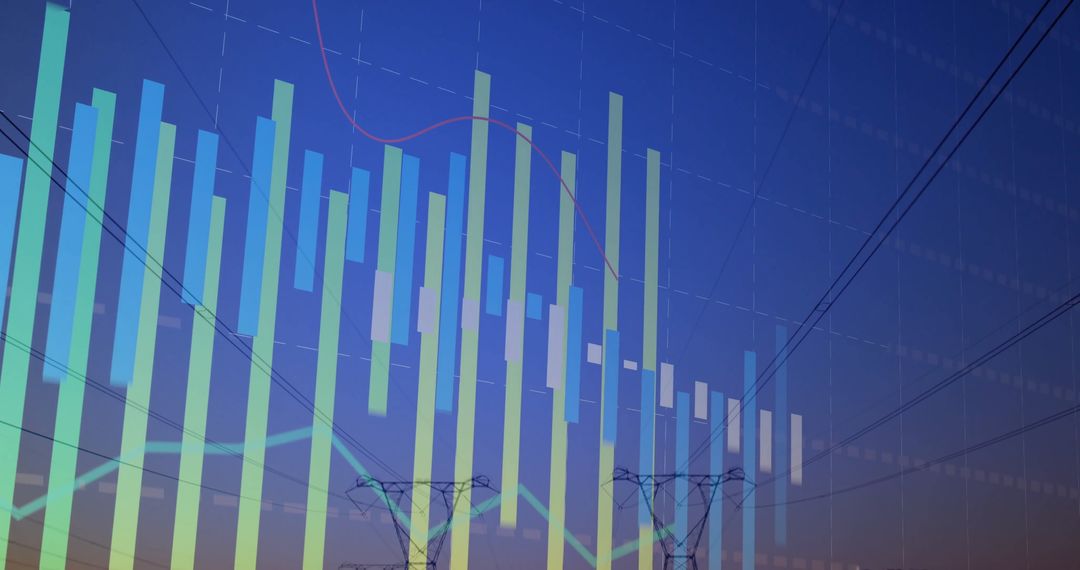
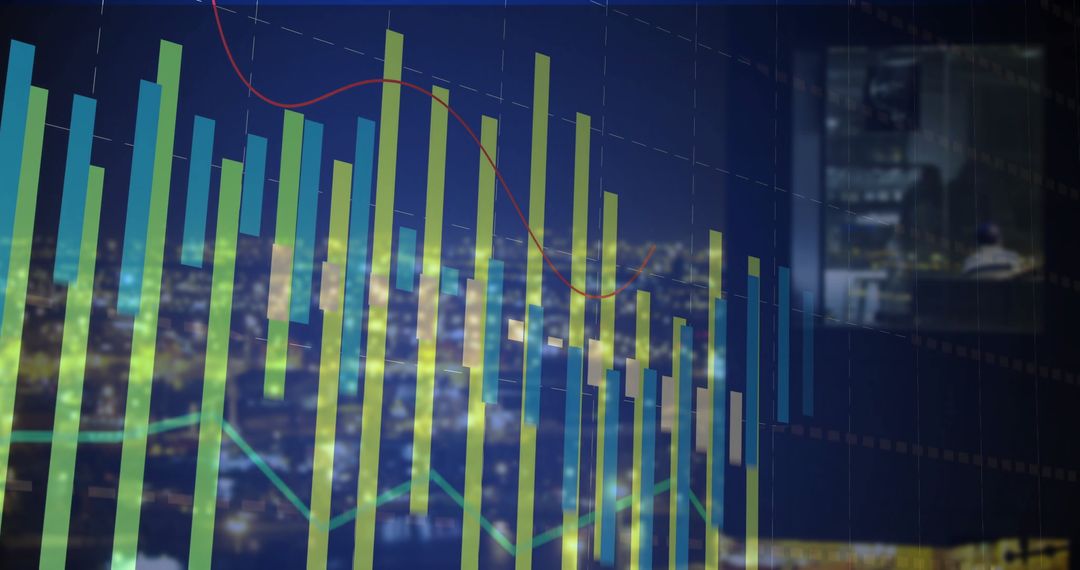
- Digital Graph and Chart Reflections on Glass Office Building
Digital Graph and Chart Reflections on Glass Office Building Image
Colorful financial and data analytics graph embeds electronic with reflection on glass skyscraper suggests merging of digital information and physical corporate space. Ideal for illustrating concepts of modern finance, business intelligence solutions identifying through handsome futuristic lines statistical growth, innovation both investments and discrepancy indicators in corporate sector.
Powered by  - Get 15% off with code: PIKWIZARD15


0
downloads
downloads
Tags:
More
Credit Photo
If you would like to credit the Photo, here are some ways you can do so
Text Link
photo Link
<span class="text-link">
<span>
<a target="_blank" href=https://pikwizard.com/photo/digital-graph-and-chart-reflections-on-glass-office-building/321418c768651458f9f355ec4ca94ea4/>PikWizard</a>
</span>
</span>
<span class="image-link">
<span
style="margin: 0 0 20px 0; display: inline-block; vertical-align: middle; width: 100%;"
>
<a
target="_blank"
href="https://pikwizard.com/photo/digital-graph-and-chart-reflections-on-glass-office-building/321418c768651458f9f355ec4ca94ea4/"
style="text-decoration: none; font-size: 10px; margin: 0;"
>
<img src="https://pikwizard.com/pw/medium/321418c768651458f9f355ec4ca94ea4.jpg" style="margin: 0; width: 100%;" alt="" />
<p style="font-size: 12px; margin: 0;">PikWizard</p>
</a>
</span>
</span>
Free (free of charge)
Free for personal and commercial use.
Author: Awesome Content
Similar Free Stock Images

Premium


Premium


Premium


Premium


Premium


Premium


Premium


Premium


Premium


Premium


Premium


Premium


Premium


Premium


Premium


Premium


Premium


Premium


Premium


Premium


Premium


Premium


Premium


Premium