
- Home >
- Stock Photos >
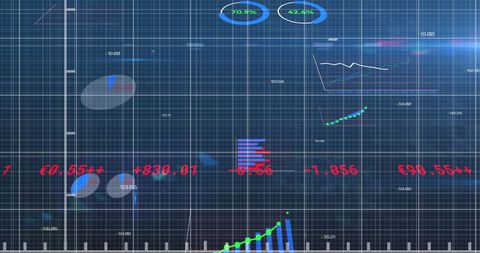
- Digital Graph and Statistics Overlay on Shipyard Background
Digital Graph and Statistics Overlay on Shipyard Background Image

Bright pink digital graph and statistics visually represented over a shipyard landscape, showcasing significant financial data and analysis trends. Ideal for content related to global business, trade, shipping industry, or financial market analysis. Useful for illustrating concepts in finance technology, economic trends, and digital analytics. Great for presenting topics on political economy impacts on the shipping industry.
Powered by 


downloads
Tags:
More
Credit Photo
If you would like to credit the Photo, here are some ways you can do so
Text Link
photo Link
<span class="text-link">
<span>
<a target="_blank" href=https://pikwizard.com/photo/digital-graph-and-statistics-overlay-on-shipyard-background/a42225aef3ea12e4aa272aa3e935e552/>PikWizard</a>
</span>
</span>
<span class="image-link">
<span
style="margin: 0 0 20px 0; display: inline-block; vertical-align: middle; width: 100%;"
>
<a
target="_blank"
href="https://pikwizard.com/photo/digital-graph-and-statistics-overlay-on-shipyard-background/a42225aef3ea12e4aa272aa3e935e552/"
style="text-decoration: none; font-size: 10px; margin: 0;"
>
<img src="https://pikwizard.com/pw/medium/a42225aef3ea12e4aa272aa3e935e552.jpg" style="margin: 0; width: 100%;" alt="" />
<p style="font-size: 12px; margin: 0;">PikWizard</p>
</a>
</span>
</span>
Free (free of charge)
Free for personal and commercial use.
Author: Creative Art
Similar Free Stock Images

Premium


Premium


Premium


Premium

Premium


Premium

Premium


Premium


Premium


Premium


Premium


Premium


Premium


Premium


Premium

Premium


Premium


Premium


Premium


Premium


Premium


Premium


Premium


Premium


Premium


Explore More Free Stock Images