
- Home >
- Stock Photos >
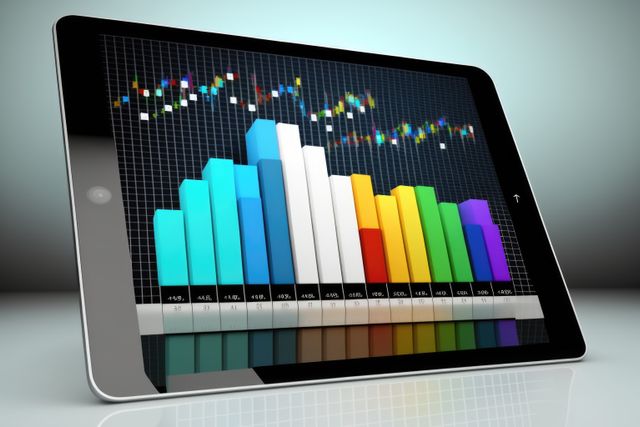
- Digital Graph Bars on Tablet Screen Display
Digital Graph Bars on Tablet Screen Display Image

AI
AI Generated Image. Vibrant digital bar graph displayed on a tablet, illustrating concepts of data analysis and statistics with colorful design elements. Ideal for visuals related to technology presentations, business analytics reports, educational resources, and digital advertisements focusing on data-driven narratives.
Powered by  - Get 15% off with code: PIKWIZARD15


downloads
Tags:
More
Credit Photo
If you would like to credit the Photo, here are some ways you can do so
Text Link
photo Link
<span class="text-link">
<span>
<a target="_blank" href=https://pikwizard.com/photo/digital-graph-bars-on-tablet-screen-display/91415588fff569880160b243ce3fd0e7/>PikWizard</a>
</span>
</span>
<span class="image-link">
<span
style="margin: 0 0 20px 0; display: inline-block; vertical-align: middle; width: 100%;"
>
<a
target="_blank"
href="https://pikwizard.com/photo/digital-graph-bars-on-tablet-screen-display/91415588fff569880160b243ce3fd0e7/"
style="text-decoration: none; font-size: 10px; margin: 0;"
>
<img src="https://pikwizard.com/pw/medium/91415588fff569880160b243ce3fd0e7.jpg" style="margin: 0; width: 100%;" alt="" />
<p style="font-size: 12px; margin: 0;">PikWizard</p>
</a>
</span>
</span>
Free (free of charge)
Free for personal and commercial use.
Author: AI Creator
Similar Free Stock Images
AI


Premium

AI


Premium


AI


Premium

Premium


Premium


AI


Premium


Premium


Premium


Premium

AI


Premium


Premium


AI


Premium


AI


Premium

AI


Premium


Premium


Premium


Premium


AI


Premium


Premium

AI


AI


Premium

AI


Premium


AI
Premium


AI


AI


AI


Premium


AI

Premium


AI


Premium

AI


AI

Explore More Free Stock Images