
- Home >
- Stock Photos >
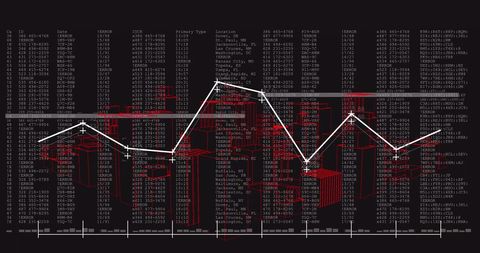
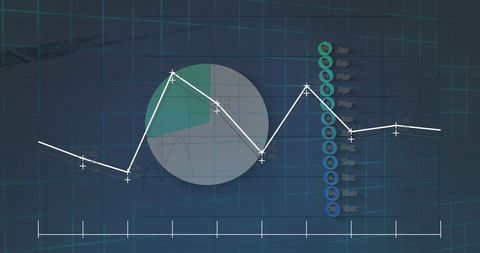
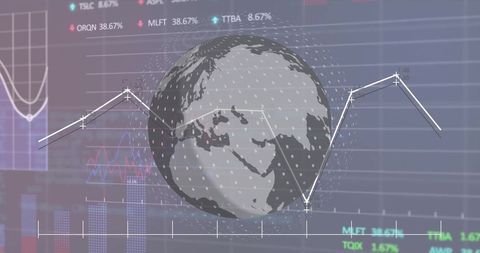
- Digital Graph Chart Displaying Financial Data Trends
Digital Graph Chart Displaying Financial Data Trends Image

This image features a digital representation of financial data trends, with various numerical points displayed on a graph chart. It is useful for illustrating concepts of business analytics, economics, and global financial markets. Ideal for use in presentations, articles related to finance and stock market analysis, and web design for economic consulting. It captures complex data processing essential for technology and finance professionals.
Powered by 


downloads
Tags:
More
Credit Photo
If you would like to credit the Photo, here are some ways you can do so
Text Link
photo Link
<span class="text-link">
<span>
<a target="_blank" href=https://pikwizard.com/photo/digital-graph-chart-displaying-financial-data-trends/b7034e0a58f1036102a84e657f50bf2b/>PikWizard</a>
</span>
</span>
<span class="image-link">
<span
style="margin: 0 0 20px 0; display: inline-block; vertical-align: middle; width: 100%;"
>
<a
target="_blank"
href="https://pikwizard.com/photo/digital-graph-chart-displaying-financial-data-trends/b7034e0a58f1036102a84e657f50bf2b/"
style="text-decoration: none; font-size: 10px; margin: 0;"
>
<img src="https://pikwizard.com/pw/medium/b7034e0a58f1036102a84e657f50bf2b.jpg" style="margin: 0; width: 100%;" alt="" />
<p style="font-size: 12px; margin: 0;">PikWizard</p>
</a>
</span>
</span>
Free (free of charge)
Free for personal and commercial use.
Author: Creative Art
Similar Free Stock Images

Premium


Premium


Premium


Premium


Premium


Premium


Premium


Premium


Premium


Premium


Premium

Premium

Premium


Premium


Premium

Premium


Premium

Premium


Premium


Premium


Premium


Premium

Premium


Premium


Premium


Explore More Free Stock Images