
- Home >
- Stock Photos >
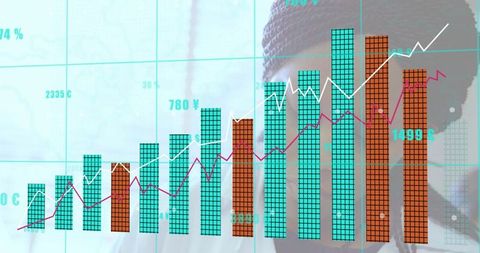
- Digital Graph Data Analysis on Abstract Pink Background
Digital Graph Data Analysis on Abstract Pink Background Image

Visual representation of digital graph used for communicating financial data and business analysis. Suits business reports, financial technology presentations, marketing materials focused on data visualization, or instructional content in finance-related courses.
Powered by 


downloads
Tags:
More
Credit Photo
If you would like to credit the Photo, here are some ways you can do so
Text Link
photo Link
<span class="text-link">
<span>
<a target="_blank" href=https://pikwizard.com/photo/digital-graph-data-analysis-on-abstract-pink-background/12ff3ea91b3970f2d0b40741bdf55599/>PikWizard</a>
</span>
</span>
<span class="image-link">
<span
style="margin: 0 0 20px 0; display: inline-block; vertical-align: middle; width: 100%;"
>
<a
target="_blank"
href="https://pikwizard.com/photo/digital-graph-data-analysis-on-abstract-pink-background/12ff3ea91b3970f2d0b40741bdf55599/"
style="text-decoration: none; font-size: 10px; margin: 0;"
>
<img src="https://pikwizard.com/pw/medium/12ff3ea91b3970f2d0b40741bdf55599.jpg" style="margin: 0; width: 100%;" alt="" />
<p style="font-size: 12px; margin: 0;">PikWizard</p>
</a>
</span>
</span>
Free (free of charge)
Free for personal and commercial use.
Author: People Creations
Similar Free Stock Images

Premium


Premium


Premium


Premium


Premium


Premium

Premium


Premium


Premium

Premium


Premium


Premium


Premium

Premium


Premium

Premium


Premium


Premium


Premium

Premium


Premium


Premium


Premium


Premium


Premium

Explore More Free Stock Images