- Home >
- Stock Photos >
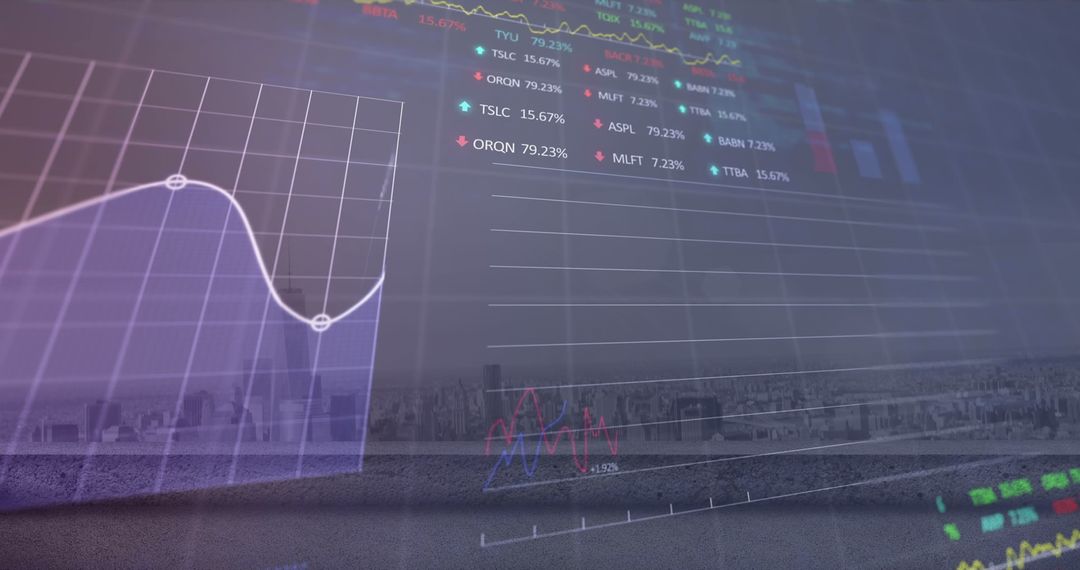
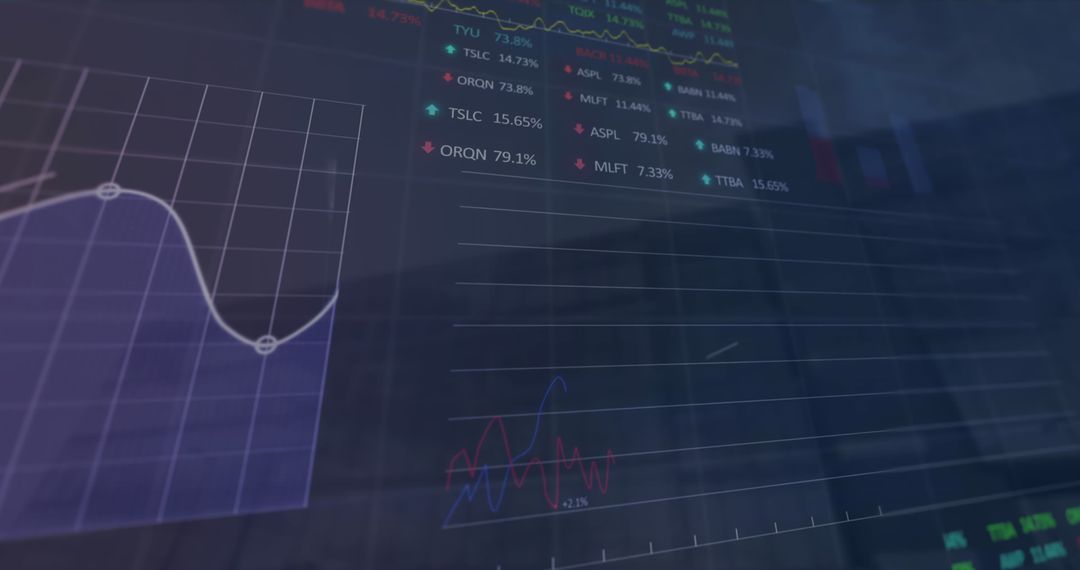
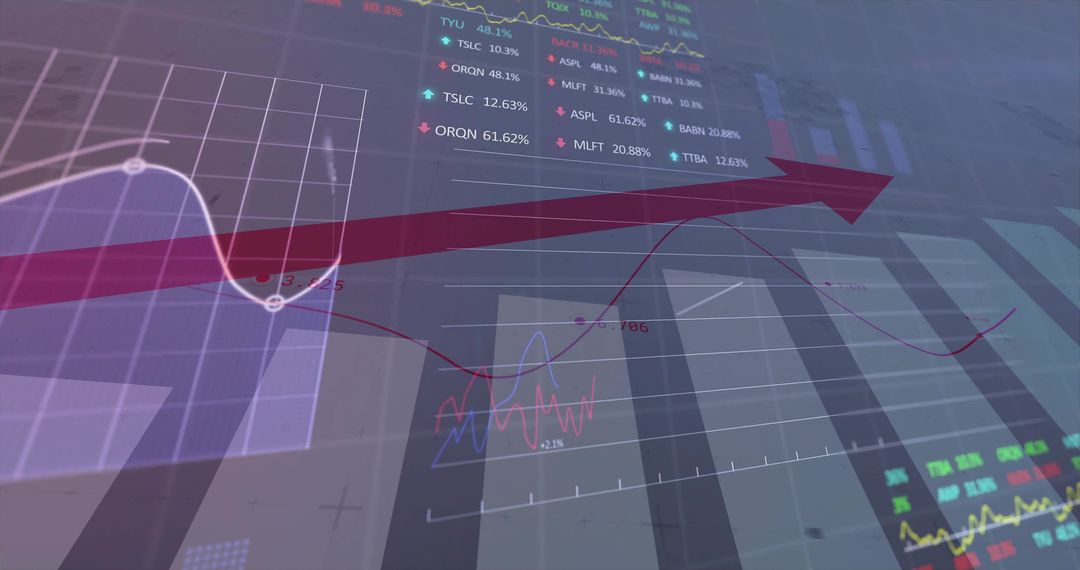
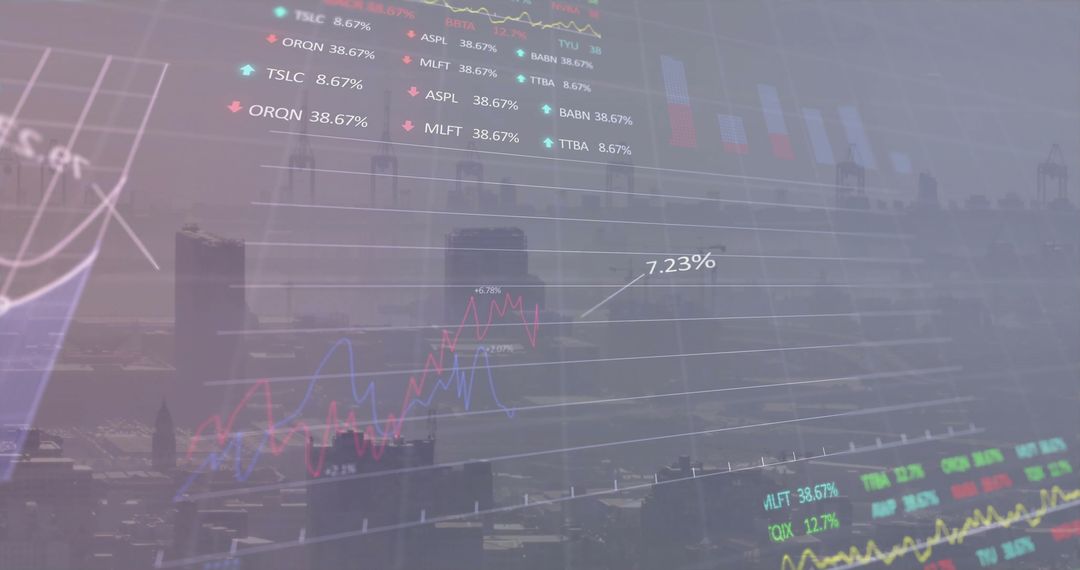
- Digital Graph Decline in Stock Prices with Financial Data Overlay
Digital Graph Decline in Stock Prices with Financial Data Overlay Image

Features digital graph illustrating sharp decline in stock prices. Background shows financial data and stylized email icons, suggesting connection to market alerts or financial notifications. Useful for depicting financial analyses, market reports, economic downturns, and educational content on stock market behavior.
Powered by 


2
downloads
downloads
Tags:
More
Credit Photo
If you would like to credit the Photo, here are some ways you can do so
Text Link
photo Link
<span class="text-link">
<span>
<a target="_blank" href=https://pikwizard.com/photo/digital-graph-decline-in-stock-prices-with-financial-data-overlay/946e1e2f2ceb5b1164ef99c57275be6f/>PikWizard</a>
</span>
</span>
<span class="image-link">
<span
style="margin: 0 0 20px 0; display: inline-block; vertical-align: middle; width: 100%;"
>
<a
target="_blank"
href="https://pikwizard.com/photo/digital-graph-decline-in-stock-prices-with-financial-data-overlay/946e1e2f2ceb5b1164ef99c57275be6f/"
style="text-decoration: none; font-size: 10px; margin: 0;"
>
<img src="https://pikwizard.com/pw/medium/946e1e2f2ceb5b1164ef99c57275be6f.jpg" style="margin: 0; width: 100%;" alt="" />
<p style="font-size: 12px; margin: 0;">PikWizard</p>
</a>
</span>
</span>
Free (free of charge)
Free for personal and commercial use.
Author: Authentic Images
Similar Free Stock Images

Premium


Premium


Premium


Premium


Premium


Premium


Premium


Premium


Premium


Premium


Premium


Premium


Premium


Premium


Premium


Premium


Premium


Premium


Premium


Premium


Premium


Premium


Premium


Premium