- Home >
- Stock Photos >
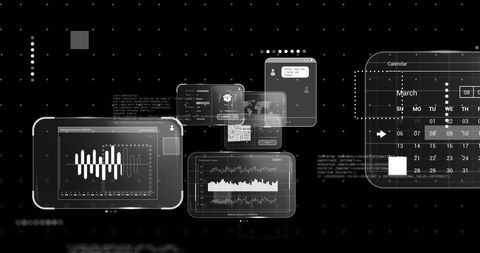
- Digital Graph Interface Displaying Financial Data
Digital Graph Interface Displaying Financial Data Image

Visual representation of financial data on a black digital interface. Ideal for illustrating global finance themes, data analysis tools, business growth presentations, or computing technologies. Suitable for articles about economic trends or financial strategy development.

downloads
Tags:
More
Credit Photo
If you would like to credit the Photo, here are some ways you can do so
Text Link
photo Link
<span class="text-link">
<span>
<a target="_blank" href=https://pikwizard.com/photo/digital-graph-interface-displaying-financial-data/cbf49cf62fb5271f785e8307314336e1/>PikWizard</a>
</span>
</span>
<span class="image-link">
<span
style="margin: 0 0 20px 0; display: inline-block; vertical-align: middle; width: 100%;"
>
<a
target="_blank"
href="https://pikwizard.com/photo/digital-graph-interface-displaying-financial-data/cbf49cf62fb5271f785e8307314336e1/"
style="text-decoration: none; font-size: 10px; margin: 0;"
>
<img src="https://pikwizard.com/pw/medium/cbf49cf62fb5271f785e8307314336e1.jpg" style="margin: 0; width: 100%;" alt="" />
<p style="font-size: 12px; margin: 0;">PikWizard</p>
</a>
</span>
</span>
Free (free of charge)
Free for personal and commercial use.
Author: People Creations