
- Home >
- Stock Photos >
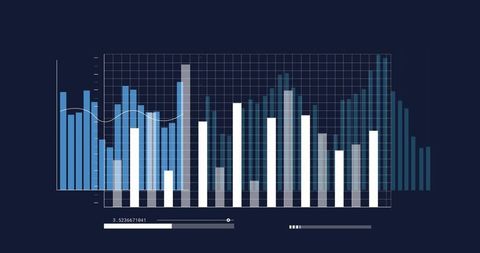
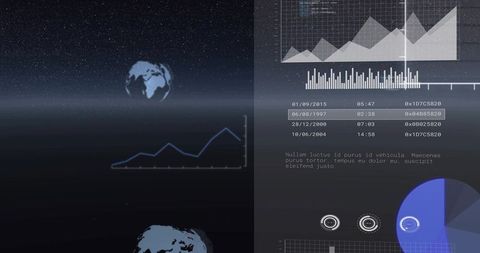
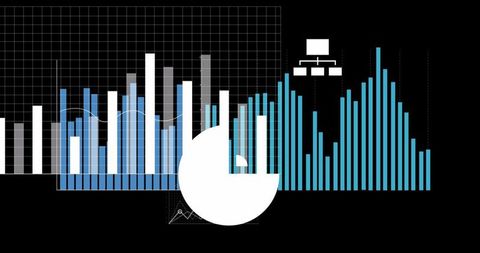
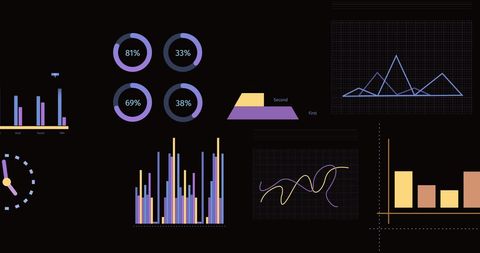
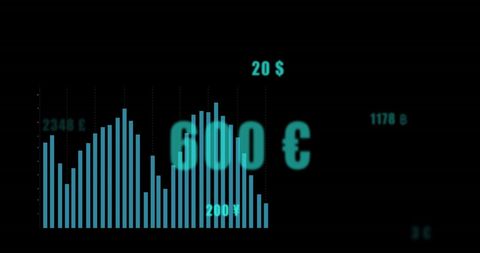
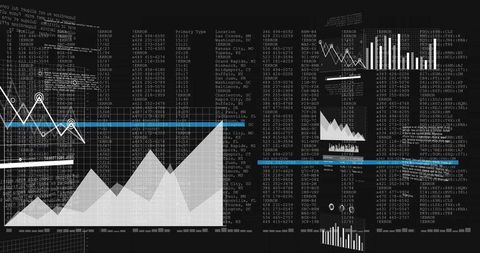
- Digital Graph Interface Illustrating Financial Data Analysis
Digital Graph Interface Illustrating Financial Data Analysis Image

These digital graphs depict various forms of financial data analysis on a sleek black background. The visuals can be utilized for presentations requiring modern technological graphics in financial sectors, illustrating complex financial or economic information. Useful for finance reports, tech-themed websites, or business strategy illustrations, conveying innovation and precision in data evaluation.
Powered by 


downloads
Tags:
More
Credit Photo
If you would like to credit the Photo, here are some ways you can do so
Text Link
photo Link
<span class="text-link">
<span>
<a target="_blank" href=https://pikwizard.com/photo/digital-graph-interface-illustrating-financial-data-analysis/4957503f11d1425e2d9615684ebf1229/>PikWizard</a>
</span>
</span>
<span class="image-link">
<span
style="margin: 0 0 20px 0; display: inline-block; vertical-align: middle; width: 100%;"
>
<a
target="_blank"
href="https://pikwizard.com/photo/digital-graph-interface-illustrating-financial-data-analysis/4957503f11d1425e2d9615684ebf1229/"
style="text-decoration: none; font-size: 10px; margin: 0;"
>
<img src="https://pikwizard.com/pw/medium/4957503f11d1425e2d9615684ebf1229.jpg" style="margin: 0; width: 100%;" alt="" />
<p style="font-size: 12px; margin: 0;">PikWizard</p>
</a>
</span>
</span>
Free (free of charge)
Free for personal and commercial use.
Author: Creative Art
Similar Free Stock Images

Premium


Premium

Premium


Premium


Premium


Premium


Premium


Premium


Premium


Premium

Premium

Premium


Premium


Premium


Premium


Premium


Premium


Premium


Premium


Premium


Premium


Premium


Premium


Premium


Premium


Explore More Free Stock Images