
- Home >
- Stock Photos >
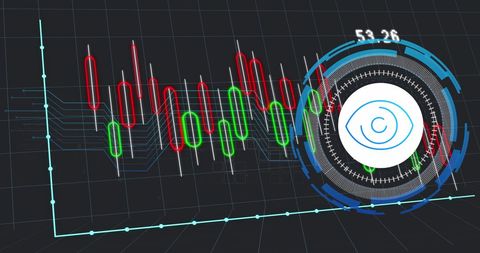
- Digital Graph Interface with Global Data Insights
Digital Graph Interface with Global Data Insights Image

Colorful digital graph with technological elements over black background conveys concept of global financial analysis and market trends. Suitable for illustrating business reports, presentations, fintech applications, or investment dashboards.
Powered by 


downloads
Tags:
More
Credit Photo
If you would like to credit the Photo, here are some ways you can do so
Text Link
photo Link
<span class="text-link">
<span>
<a target="_blank" href=https://pikwizard.com/photo/digital-graph-interface-with-global-data-insights/8c981b26e8e1ac4a95548bbfd72bb310/>PikWizard</a>
</span>
</span>
<span class="image-link">
<span
style="margin: 0 0 20px 0; display: inline-block; vertical-align: middle; width: 100%;"
>
<a
target="_blank"
href="https://pikwizard.com/photo/digital-graph-interface-with-global-data-insights/8c981b26e8e1ac4a95548bbfd72bb310/"
style="text-decoration: none; font-size: 10px; margin: 0;"
>
<img src="https://pikwizard.com/pw/medium/8c981b26e8e1ac4a95548bbfd72bb310.jpg" style="margin: 0; width: 100%;" alt="" />
<p style="font-size: 12px; margin: 0;">PikWizard</p>
</a>
</span>
</span>
Free (free of charge)
Free for personal and commercial use.
Author: Awesome Content
Similar Free Stock Images

Premium


Premium


Premium


Premium


Premium


Premium


Premium


Premium


Premium


Premium


Premium


Premium


Premium


Premium


Premium


Premium


Premium

Premium

Premium


Premium


Premium


Premium


Premium


Premium


Premium

Explore More Free Stock Images