
- Home >
- Stock Photos >
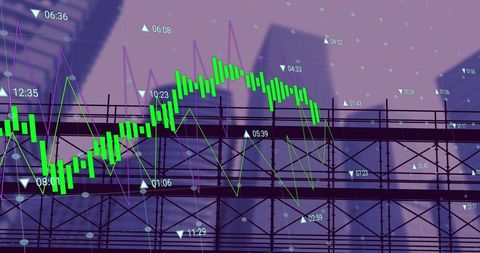
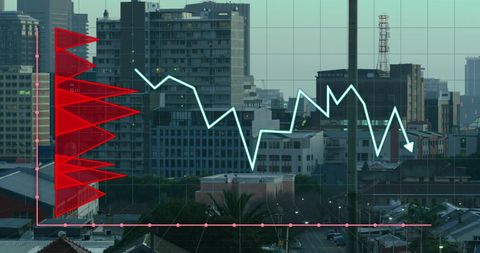
- Digital Graph Overlay on Modern Corporate Skyscraper
Digital Graph Overlay on Modern Corporate Skyscraper Image

Graph overlay is set against a high-rise office building, symbolizing modern financial and technological realms. Utilized for projects involving data analysis presentations, finance-themed advertising, and corporate identity design emphasizing innovation.
Powered by  - Get 15% off with code: PIKWIZARD15


downloads
Tags:
More
Credit Photo
If you would like to credit the Photo, here are some ways you can do so
Text Link
photo Link
<span class="text-link">
<span>
<a target="_blank" href=https://pikwizard.com/photo/digital-graph-overlay-on-modern-corporate-skyscraper/7f48c33d6983a75707491d5a4aaef8a6/>PikWizard</a>
</span>
</span>
<span class="image-link">
<span
style="margin: 0 0 20px 0; display: inline-block; vertical-align: middle; width: 100%;"
>
<a
target="_blank"
href="https://pikwizard.com/photo/digital-graph-overlay-on-modern-corporate-skyscraper/7f48c33d6983a75707491d5a4aaef8a6/"
style="text-decoration: none; font-size: 10px; margin: 0;"
>
<img src="https://pikwizard.com/pw/medium/7f48c33d6983a75707491d5a4aaef8a6.jpg" style="margin: 0; width: 100%;" alt="" />
<p style="font-size: 12px; margin: 0;">PikWizard</p>
</a>
</span>
</span>
Free (free of charge)
Free for personal and commercial use.
Author: Authentic Images
Similar Free Stock Images

Premium


Premium


Premium


Premium


Premium
Premium


Premium


Premium


Premium


Premium


Premium


Premium


Premium

Premium


Premium


Premium


Premium


Premium


Premium

Premium


Premium


Premium


Premium


Premium


Premium


Explore More Free Stock Images