
- Home >
- Stock Photos >
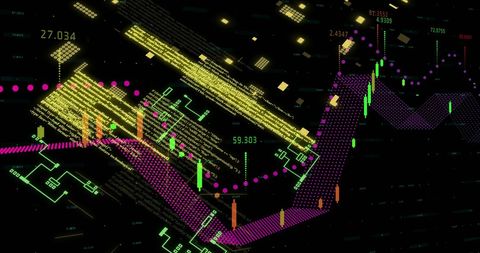
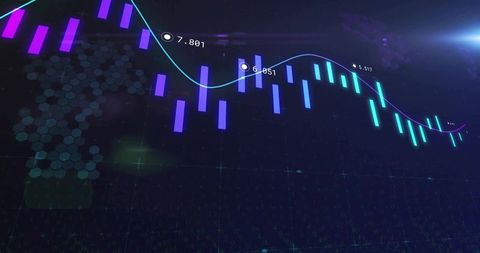
- Digital Graph Showing Data Processing on Dark Tech Background
Digital Graph Showing Data Processing on Dark Tech Background Image

Vivid digital graph overlays technical visualization of data processing on a dark background, exhibiting numbers and signals indicative of statistical analysis and communication networks. Use this in illustrating global business strategies, financial reports, or conveying complex data interpretation in technology publications and presentations.
Powered by  - Get 15% off with code: PIKWIZARD15


downloads
Tags:
More
Credit Photo
If you would like to credit the Photo, here are some ways you can do so
Text Link
photo Link
<span class="text-link">
<span>
<a target="_blank" href=https://pikwizard.com/photo/digital-graph-showing-data-processing-on-dark-tech-background/239d4c1a876321a63b78eb0d7da442c1/>PikWizard</a>
</span>
</span>
<span class="image-link">
<span
style="margin: 0 0 20px 0; display: inline-block; vertical-align: middle; width: 100%;"
>
<a
target="_blank"
href="https://pikwizard.com/photo/digital-graph-showing-data-processing-on-dark-tech-background/239d4c1a876321a63b78eb0d7da442c1/"
style="text-decoration: none; font-size: 10px; margin: 0;"
>
<img src="https://pikwizard.com/pw/medium/239d4c1a876321a63b78eb0d7da442c1.jpg" style="margin: 0; width: 100%;" alt="" />
<p style="font-size: 12px; margin: 0;">PikWizard</p>
</a>
</span>
</span>
Free (free of charge)
Free for personal and commercial use.
Author: People Creations
Similar Free Stock Images

Premium

Premium


Premium


Premium


Premium


Premium


Premium

Premium


Premium

Premium

Premium


Premium


Premium


Premium


Premium


Premium


Premium


Premium


Premium


Premium


Premium


Premium


Premium


Premium


Premium


Explore More Free Stock Images