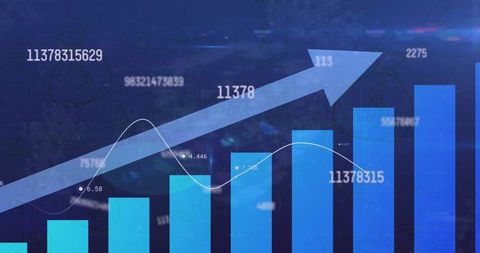
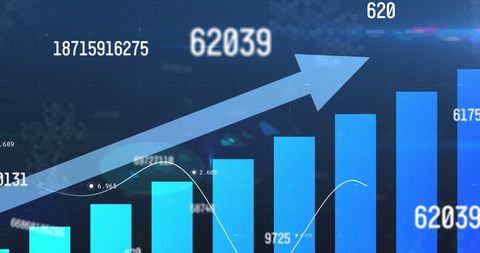
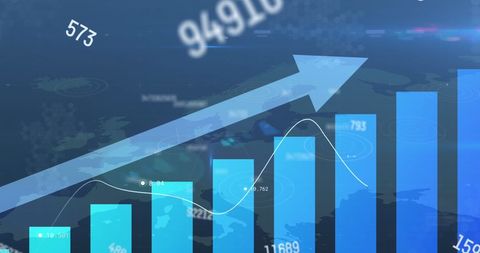
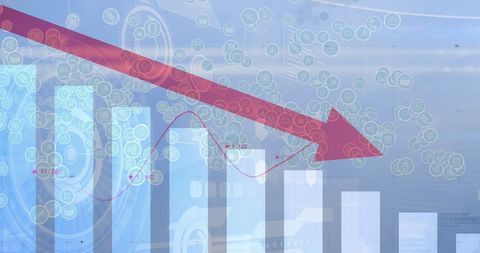
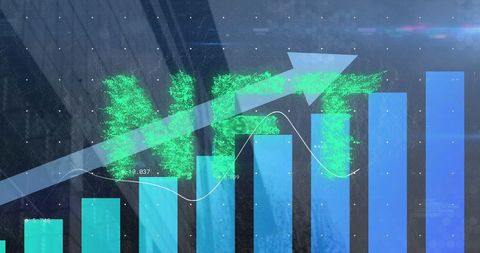
digital financial analytics with growing bar chart Image

Complex light blurs over digital financial metrics and stylized bar chart with arrows conveys successful business analytics. Useful for illustrating global financial growth, data-driven decision making, investment strategy briefing, technology development in financial sectors, and positive business trends visualizations.
Powered by  - Get 15% off with code: PIKWIZARD15


1
downloads
downloads
Credit Photo
If you would like to credit the Photo, here are some ways you can do so
Text Link
photo Link
<span class="text-link">
<span>
<a target="_blank" href=https://pikwizard.com/photo/digital-financial-analytics-with-growing-bar-chart/52144ffb2e6073de383088a25a79a352/>PikWizard</a>
</span>
</span>
<span class="image-link">
<span
style="margin: 0 0 20px 0; display: inline-block; vertical-align: middle; width: 100%;"
>
<a
target="_blank"
href="https://pikwizard.com/photo/digital-financial-analytics-with-growing-bar-chart/52144ffb2e6073de383088a25a79a352/"
style="text-decoration: none; font-size: 10px; margin: 0;"
>
<img src="https://pikwizard.com/pw/medium/52144ffb2e6073de383088a25a79a352.jpg" style="margin: 0; width: 100%;" alt="" />
<p style="font-size: 12px; margin: 0;">PikWizard</p>
</a>
</span>
</span>
Free (free of charge)
Free for personal and commercial use.
Author: Authentic Images
Similar Free Stock Images
Premium


Premium

Premium


Premium


Premium


Premium


Premium


Premium


Premium


Premium

Premium


Premium


Premium


Premium

Premium


Premium
Premium

Premium
Premium


Premium


Premium


Premium


Premium
Premium