
- Home >
- Stock Photos >
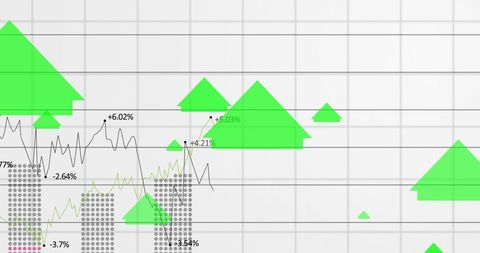
- Digital Graph with Overlaying Blue Shapes on Green Grid Background
Digital Graph with Overlaying Blue Shapes on Green Grid Background Image

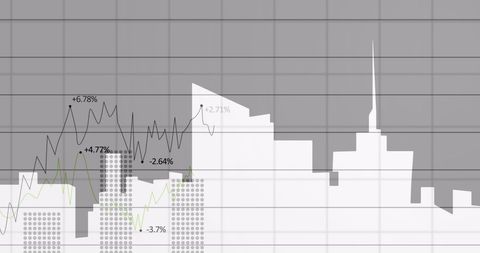
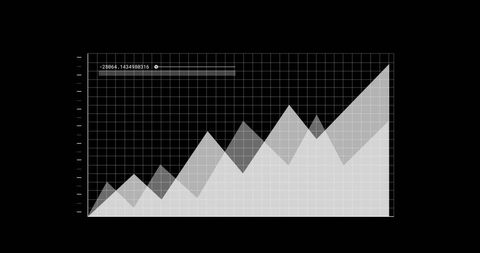
Abstract representation of digital data visualization using blue geometric shapes placed over a chart on a green grid background. Illustrates concepts of business analysis, data monitoring, and technological interface design. Suitable for business presentations, technology blogs, websites, and digital branding materials to emphasize analytics and modern data systems.
Powered by  - Get 15% off with code: PIKWIZARD15


downloads
Tags:
More
Credit Photo
If you would like to credit the Photo, here are some ways you can do so
Text Link
photo Link
<span class="text-link">
<span>
<a target="_blank" href=https://pikwizard.com/photo/digital-graph-with-overlaying-blue-shapes-on-green-grid-background/34969857cf71b76ef8dc2f41b71b37f6/>PikWizard</a>
</span>
</span>
<span class="image-link">
<span
style="margin: 0 0 20px 0; display: inline-block; vertical-align: middle; width: 100%;"
>
<a
target="_blank"
href="https://pikwizard.com/photo/digital-graph-with-overlaying-blue-shapes-on-green-grid-background/34969857cf71b76ef8dc2f41b71b37f6/"
style="text-decoration: none; font-size: 10px; margin: 0;"
>
<img src="https://pikwizard.com/pw/medium/34969857cf71b76ef8dc2f41b71b37f6.jpg" style="margin: 0; width: 100%;" alt="" />
<p style="font-size: 12px; margin: 0;">PikWizard</p>
</a>
</span>
</span>
Free (free of charge)
Free for personal and commercial use.
Author: Authentic Images
Similar Free Stock Images
Loading...

Premium


Premium

Premium

Premium


Premium

Premium


Premium

Premium

Premium

Premium


Premium


Premium


Premium


Premium


Premium


Premium


Premium


Premium

Premium

Premium


Premium

Premium


Premium


Premium


Premium
