- Home >
- Stock Photos >
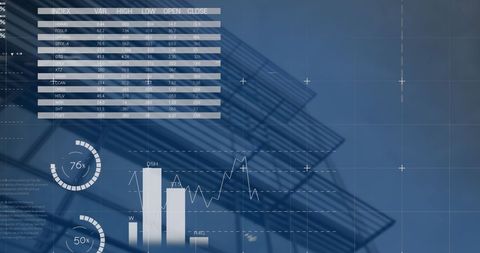
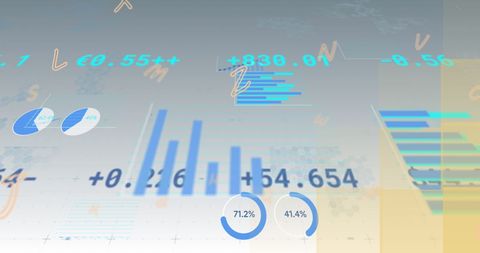
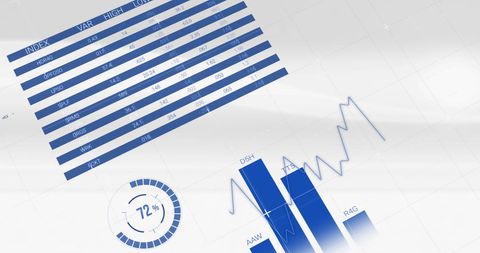
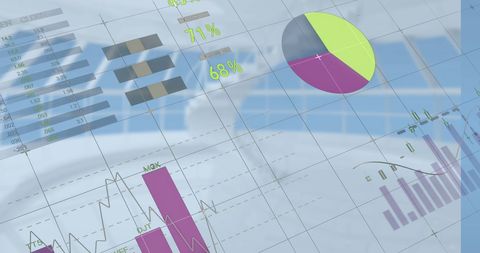
- Digital Graphs and Charts in a Financial Data Visualization Concept
Digital Graphs and Charts in a Financial Data Visualization Concept Image

This depiction of graphs and charts represents concepts of financial data processing and business analytics. Sharply designed with bold blue elements, it is fitting for use in presentations, reports, or marketing materials related to global business strategies, data analysis, and information management. It can visually communicate ideas of trend analysis, performance evaluation, and statistical examination, benefiting industries focused on finance, economics, and business intelligence.

downloads
Tags:
More
Credit Photo
If you would like to credit the Photo, here are some ways you can do so
Text Link
photo Link
<span class="text-link">
<span>
<a target="_blank" href=https://pikwizard.com/photo/digital-graphs-and-charts-in-a-financial-data-visualization-concept/ed9ee91c7420b6ee90c7112bf288382d/>PikWizard</a>
</span>
</span>
<span class="image-link">
<span
style="margin: 0 0 20px 0; display: inline-block; vertical-align: middle; width: 100%;"
>
<a
target="_blank"
href="https://pikwizard.com/photo/digital-graphs-and-charts-in-a-financial-data-visualization-concept/ed9ee91c7420b6ee90c7112bf288382d/"
style="text-decoration: none; font-size: 10px; margin: 0;"
>
<img src="https://pikwizard.com/pw/medium/ed9ee91c7420b6ee90c7112bf288382d.jpg" style="margin: 0; width: 100%;" alt="" />
<p style="font-size: 12px; margin: 0;">PikWizard</p>
</a>
</span>
</span>
Free (free of charge)
Free for personal and commercial use.
Author: Awesome Content