
- Home >
- Stock Photos >
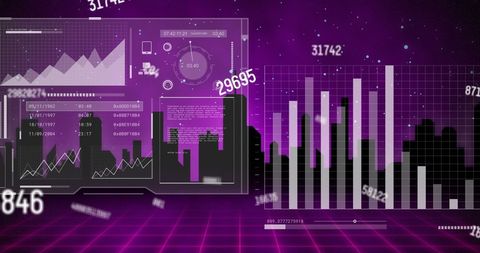
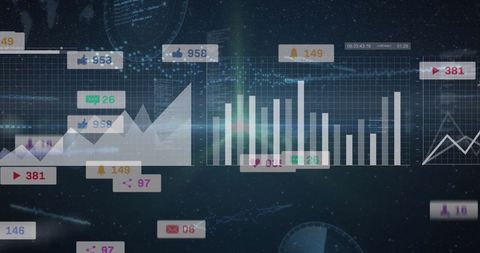
- Digital Graphs and Data Analysis Hologram
Digital Graphs and Data Analysis Hologram Image
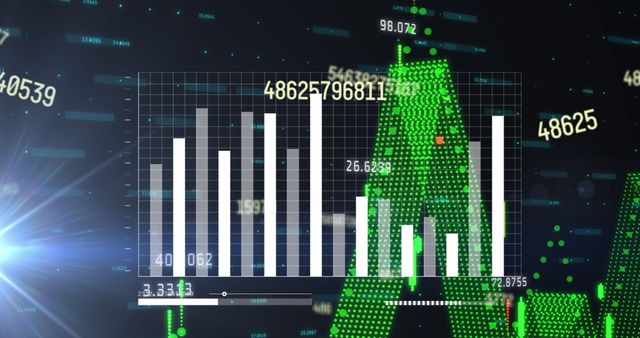
Depicting a holographic display of bar graphs, loading bars, and changing numerical data against a dark backdrop, this design represents the intersection of technical analysis and modern business. Icons and digits shimmer, invoking concepts of business growth, data analytics, and financial reporting. Valuable for venture presentations, stock market layouts, or technology-driven marketing materials.
Powered by  - Get 15% off with code: PIKWIZARD15


downloads
Tags:
More
Credit Photo
If you would like to credit the Photo, here are some ways you can do so
Text Link
photo Link
<span class="text-link">
<span>
<a target="_blank" href=https://pikwizard.com/photo/digital-graphs-and-data-analysis-hologram/84165ee8935cebb2810d01c7edca4f58/>PikWizard</a>
</span>
</span>
<span class="image-link">
<span
style="margin: 0 0 20px 0; display: inline-block; vertical-align: middle; width: 100%;"
>
<a
target="_blank"
href="https://pikwizard.com/photo/digital-graphs-and-data-analysis-hologram/84165ee8935cebb2810d01c7edca4f58/"
style="text-decoration: none; font-size: 10px; margin: 0;"
>
<img src="https://pikwizard.com/pw/medium/84165ee8935cebb2810d01c7edca4f58.jpg" style="margin: 0; width: 100%;" alt="" />
<p style="font-size: 12px; margin: 0;">PikWizard</p>
</a>
</span>
</span>
Free (free of charge)
Free for personal and commercial use.
Author: Creative Art
Similar Free Stock Images

Premium


Premium


Premium


Premium


Premium


Premium


Premium


Premium


Premium


Premium


Premium


Premium


Premium


Premium


Premium


Premium


Premium

Premium


Premium


Premium

Premium

Premium


Premium


Premium


Premium

Explore More Free Stock Images