- Home >
- Stock Photos >
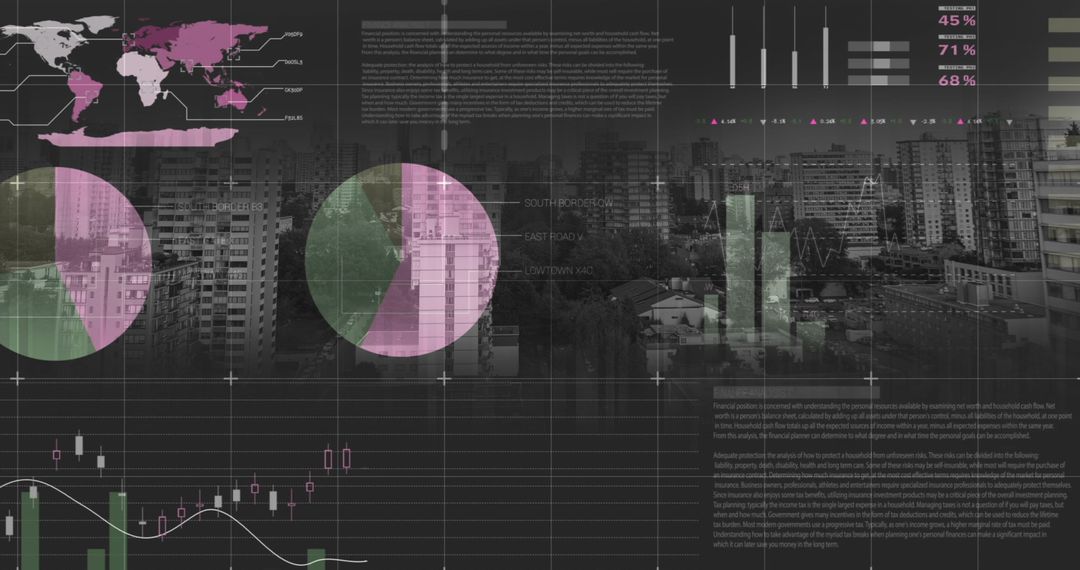
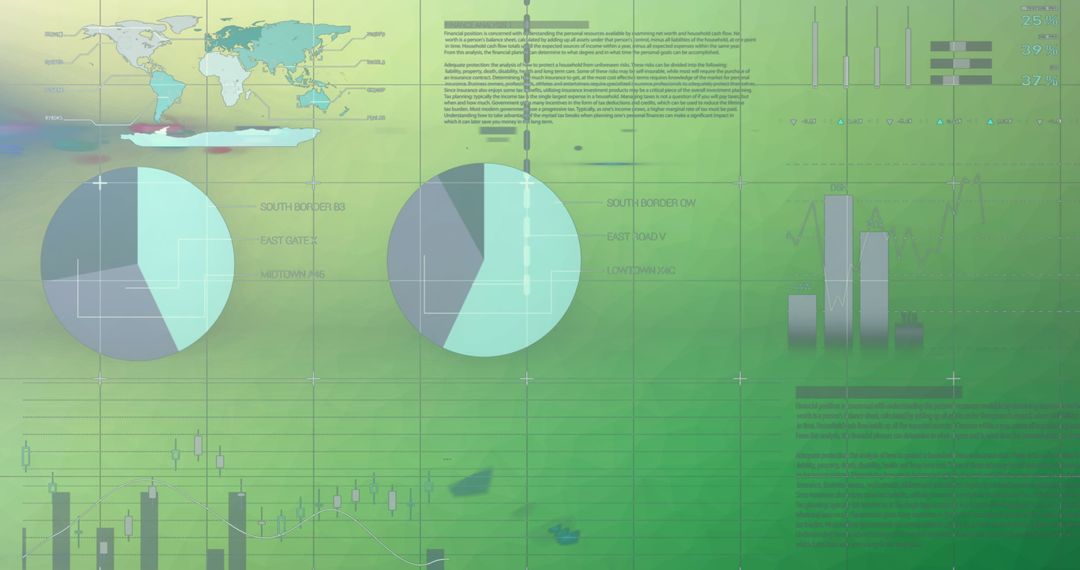
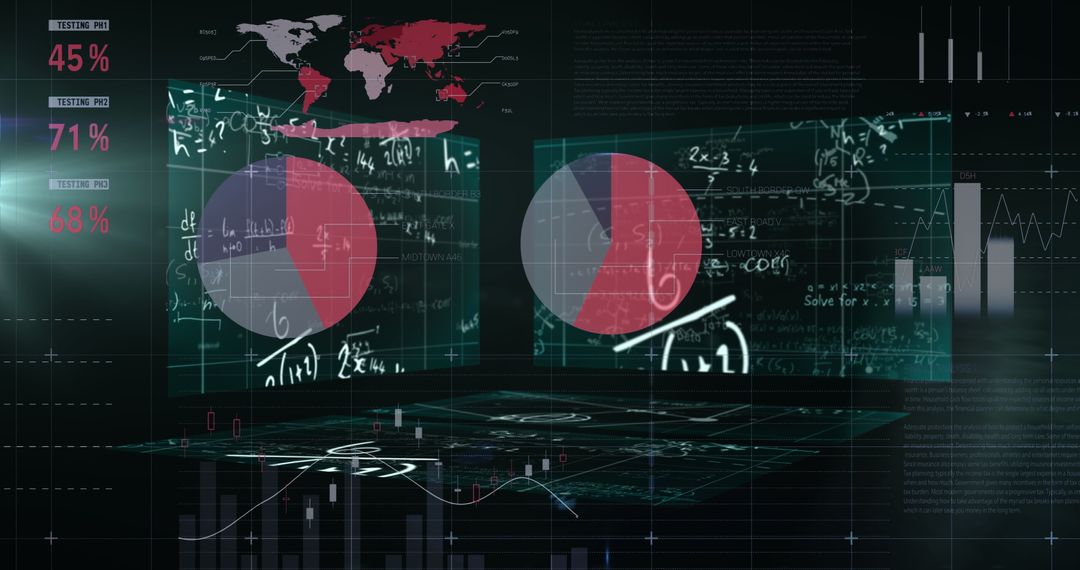
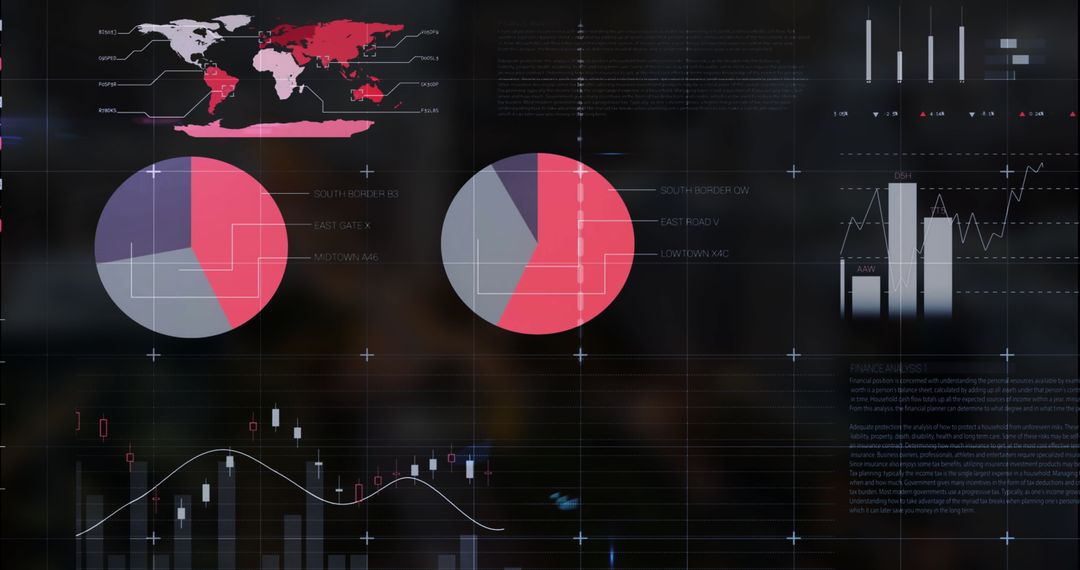
- Digital Graphs and Equations on Black Background for Business and Education
Digital Graphs and Equations on Black Background for Business and Education Image
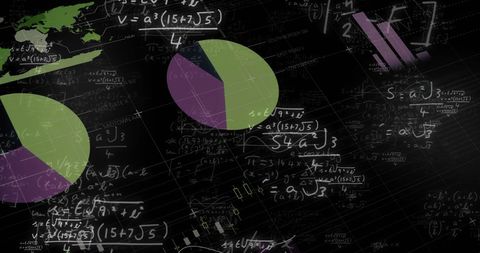
This image showcases multicolored graphs and complex mathematical equations on a black background, creating a futuristic and digital interface suitable for illustrating concepts in business analytics, finance, and education. Ideal for presentations or content titles dealing with data visualization, analytical strategies, and technological advancements.
Powered by  - Get 15% off with code: PIKWIZARD15


2
downloads
downloads
Tags:
More
Credit Photo
If you would like to credit the Photo, here are some ways you can do so
Text Link
photo Link
<span class="text-link">
<span>
<a target="_blank" href=https://pikwizard.com/photo/digital-graphs-and-equations-on-black-background-for-business-and-education/cba59a8183e569d01ecf3f032d9a24e9/>PikWizard</a>
</span>
</span>
<span class="image-link">
<span
style="margin: 0 0 20px 0; display: inline-block; vertical-align: middle; width: 100%;"
>
<a
target="_blank"
href="https://pikwizard.com/photo/digital-graphs-and-equations-on-black-background-for-business-and-education/cba59a8183e569d01ecf3f032d9a24e9/"
style="text-decoration: none; font-size: 10px; margin: 0;"
>
<img src="https://pikwizard.com/pw/medium/cba59a8183e569d01ecf3f032d9a24e9.jpg" style="margin: 0; width: 100%;" alt="" />
<p style="font-size: 12px; margin: 0;">PikWizard</p>
</a>
</span>
</span>
Free (free of charge)
Free for personal and commercial use.
Author: Awesome Content
Similar Free Stock Images

Premium


Premium


Premium


Premium


Premium


Premium


Premium


Premium


Premium


Premium


Premium


Premium


Premium


Premium


Premium


Premium


Premium


Premium


Premium


Premium


Premium


Premium


Premium


Premium