
- Home >
- Stock Photos >
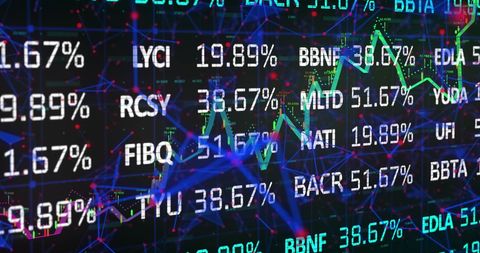
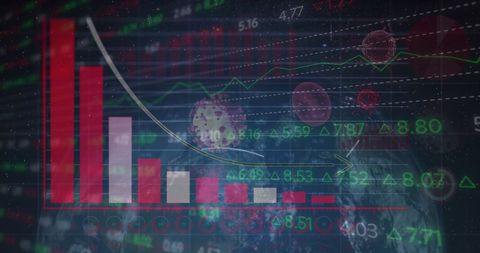
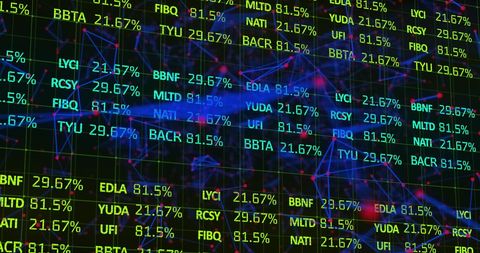
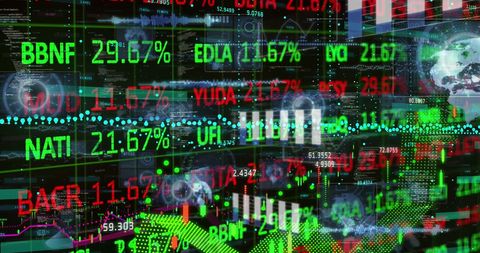
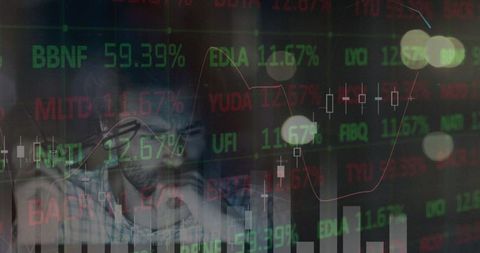
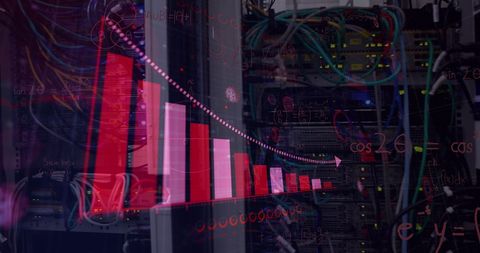
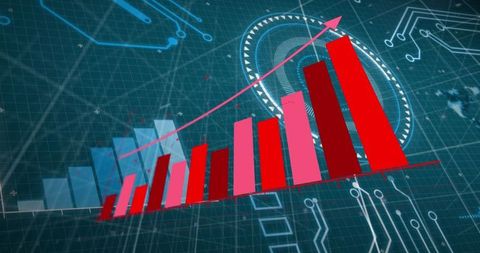
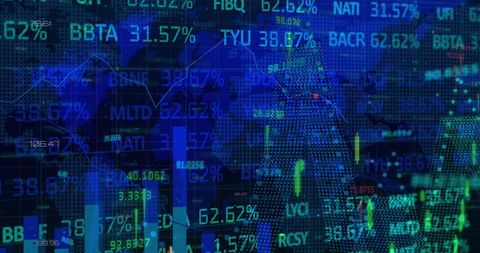
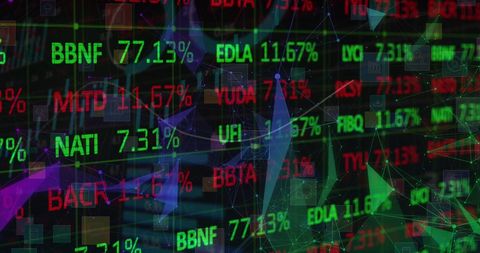
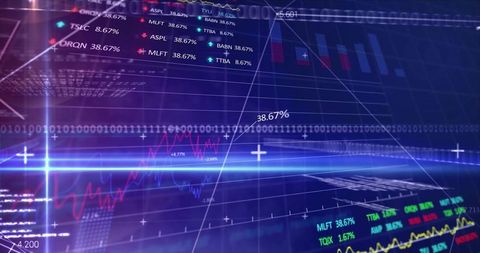
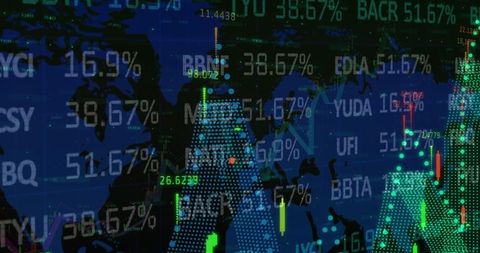
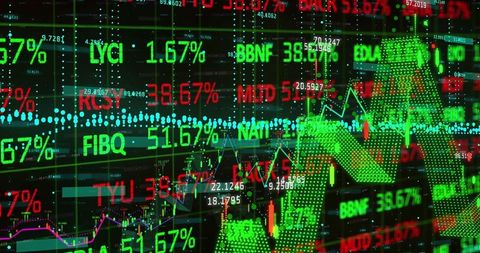
- Digital Graphs and Financial Data on Screen
Digital Graphs and Financial Data on Screen Image
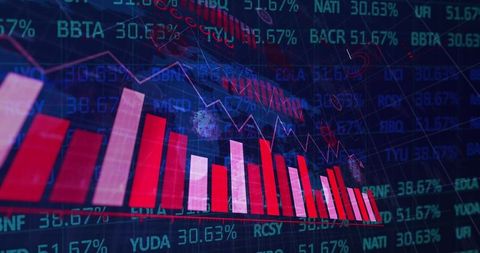
Dynamic visualization of financial trends with digital bar graphs and numerical data reflecting the stock market. Provides a high-tech feel suitable for illustrating concepts in global finance, technology’s impact in economics, and investment environments. Suitable for use in financial reports, business presentations, and online platforms focusing on economic analyses and technological advancements.
Powered by  - Get 15% off with code: PIKWIZARD15


downloads
Tags:
More
Credit Photo
If you would like to credit the Photo, here are some ways you can do so
Text Link
photo Link
<span class="text-link">
<span>
<a target="_blank" href=https://pikwizard.com/photo/digital-graphs-and-financial-data-on-screen/cf2262bb6fcd002f89afff3d40f0dd64/>PikWizard</a>
</span>
</span>
<span class="image-link">
<span
style="margin: 0 0 20px 0; display: inline-block; vertical-align: middle; width: 100%;"
>
<a
target="_blank"
href="https://pikwizard.com/photo/digital-graphs-and-financial-data-on-screen/cf2262bb6fcd002f89afff3d40f0dd64/"
style="text-decoration: none; font-size: 10px; margin: 0;"
>
<img src="https://pikwizard.com/pw/medium/cf2262bb6fcd002f89afff3d40f0dd64.jpg" style="margin: 0; width: 100%;" alt="" />
<p style="font-size: 12px; margin: 0;">PikWizard</p>
</a>
</span>
</span>
Free (free of charge)
Free for personal and commercial use.
Author: Authentic Images
Similar Free Stock Images

Premium


Premium


Premium


Premium


Premium


Premium


Premium


Premium

Premium


Premium


Premium


Premium


Premium

Premium

Premium


Premium


Premium


Premium

Premium


Premium


Premium


Premium

Premium

Premium


Premium

Explore More Free Stock Images