
- Home >
- Stock Photos >
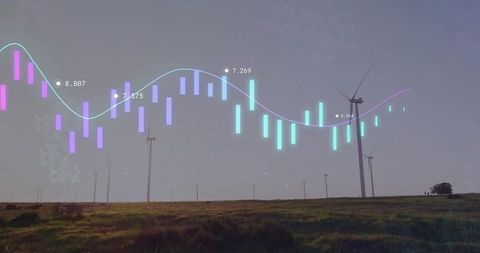
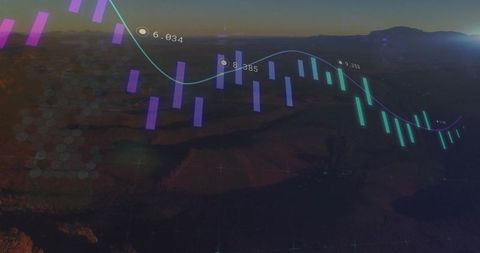
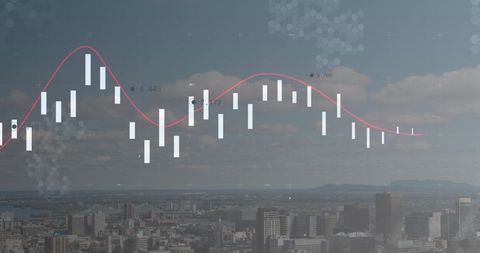
- Digital Graphs Over Cityscape and Trees Reflected
Digital Graphs Over Cityscape and Trees Reflected Image
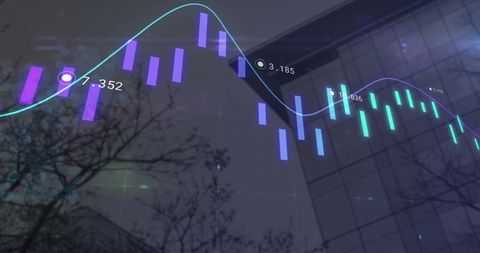
Visualizing digital graphs overlaying a cityscape, blended with reflections of trees and buildings, giving a futuristic look. Represents concepts of data analytics, financial markets, and technological advancement. Useful for finance industry presentations, reports on market trends, or articles related to technology integration in stock trading.
Powered by  - Get 15% off with code: PIKWIZARD15


downloads
Tags:
More
Credit Photo
If you would like to credit the Photo, here are some ways you can do so
Text Link
photo Link
<span class="text-link">
<span>
<a target="_blank" href=https://pikwizard.com/photo/digital-graphs-over-cityscape-and-trees-reflected/f495bd0056aabfba59c6769a5aa5976a/>PikWizard</a>
</span>
</span>
<span class="image-link">
<span
style="margin: 0 0 20px 0; display: inline-block; vertical-align: middle; width: 100%;"
>
<a
target="_blank"
href="https://pikwizard.com/photo/digital-graphs-over-cityscape-and-trees-reflected/f495bd0056aabfba59c6769a5aa5976a/"
style="text-decoration: none; font-size: 10px; margin: 0;"
>
<img src="https://pikwizard.com/pw/medium/f495bd0056aabfba59c6769a5aa5976a.jpg" style="margin: 0; width: 100%;" alt="" />
<p style="font-size: 12px; margin: 0;">PikWizard</p>
</a>
</span>
</span>
Free (free of charge)
Free for personal and commercial use.
Author: People Creations
Similar Free Stock Images

Premium


Premium


Premium


Premium


Premium


Premium


Premium

Premium


Premium


Premium


Premium

Premium


Premium


Premium


Premium


Premium


Premium


Premium


Premium


Premium


Premium

Premium


Premium


Premium


Premium


Explore More Free Stock Images