
- Home >
- Stock Photos >
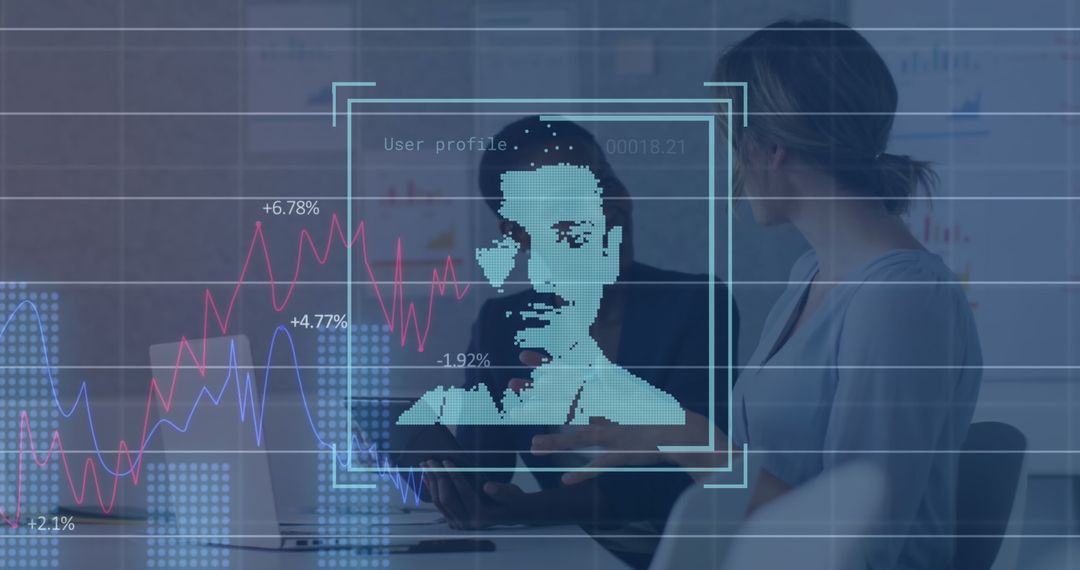
- Digital Graphs Overlay on Businessman Using Smartphone Concept
Digital Graphs Overlay on Businessman Using Smartphone Concept Image

Visual representation merging financial data and a businessman using a smartphone, symbolizing modern finance and technology integration. Ideal for illustrating concepts in financial analysis, stock market dynamics, and business technology solutions. Useful for presentations and articles discussing data trends within the financial sector.
Powered by 


0
downloads
downloads
Tags:
More
Credit Photo
If you would like to credit the Photo, here are some ways you can do so
Text Link
photo Link
<span class="text-link">
<span>
<a target="_blank" href=https://pikwizard.com/photo/digital-graphs-overlay-on-businessman-using-smartphone-concept/60651ffb62e18742ef444969c82bd0e9/>PikWizard</a>
</span>
</span>
<span class="image-link">
<span
style="margin: 0 0 20px 0; display: inline-block; vertical-align: middle; width: 100%;"
>
<a
target="_blank"
href="https://pikwizard.com/photo/digital-graphs-overlay-on-businessman-using-smartphone-concept/60651ffb62e18742ef444969c82bd0e9/"
style="text-decoration: none; font-size: 10px; margin: 0;"
>
<img src="https://pikwizard.com/pw/medium/60651ffb62e18742ef444969c82bd0e9.jpg" style="margin: 0; width: 100%;" alt="" />
<p style="font-size: 12px; margin: 0;">PikWizard</p>
</a>
</span>
</span>
Free (free of charge)
Free for personal and commercial use.
Author: Creative Art
Similar Free Stock Images

Premium


Premium


Premium


Premium


Premium


Premium


Premium


Premium


Premium


Premium


Premium


Premium


Premium


Premium


Premium


Premium


Premium


Premium


Premium


Premium


Premium


Premium


Premium


Premium

