
- Home >
- Stock Photos >
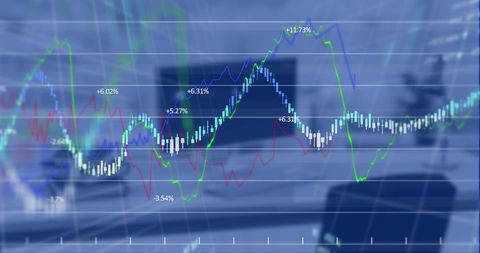
- Digital Graphs Overlaying Office Desk with Computers
Digital Graphs Overlaying Office Desk with Computers Image
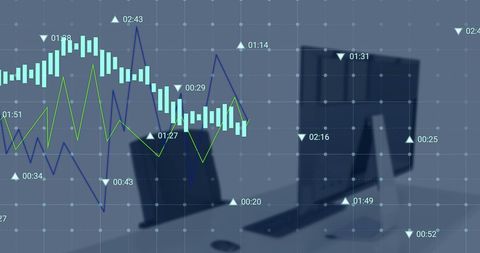
Visual representation of digital graphs superimposed on modest office with computer screens, conveying sense of modern technology and business analysis. Great for use in presentations about finance, stock market analysis, digital communication tools, business strategies and modern office environments.
Powered by  - Get 15% off with code: PIKWIZARD15


downloads
Tags:
More
Credit Photo
If you would like to credit the Photo, here are some ways you can do so
Text Link
photo Link
<span class="text-link">
<span>
<a target="_blank" href=https://pikwizard.com/photo/digital-graphs-overlaying-office-desk-with-computers/a5fa07e7c4889b179c4f5f767bfc9e59/>PikWizard</a>
</span>
</span>
<span class="image-link">
<span
style="margin: 0 0 20px 0; display: inline-block; vertical-align: middle; width: 100%;"
>
<a
target="_blank"
href="https://pikwizard.com/photo/digital-graphs-overlaying-office-desk-with-computers/a5fa07e7c4889b179c4f5f767bfc9e59/"
style="text-decoration: none; font-size: 10px; margin: 0;"
>
<img src="https://pikwizard.com/pw/medium/a5fa07e7c4889b179c4f5f767bfc9e59.jpg" style="margin: 0; width: 100%;" alt="" />
<p style="font-size: 12px; margin: 0;">PikWizard</p>
</a>
</span>
</span>
Free (free of charge)
Free for personal and commercial use.
Author: Creative Art
Similar Free Stock Images

Premium


Premium


Premium


Premium


Premium


Premium


Premium


Premium
Premium
Premium


Premium


Premium


Premium


Premium


Premium

Premium


Premium


Premium


Premium


Premium


Premium


Premium


Premium


Premium


Premium


Explore More Free Stock Images