- Home >
- Stock Photos >
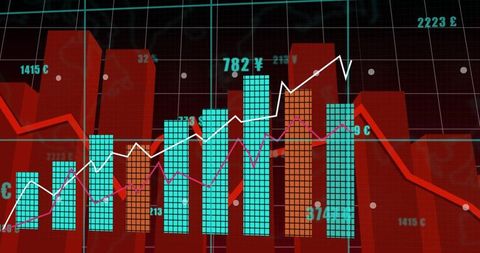
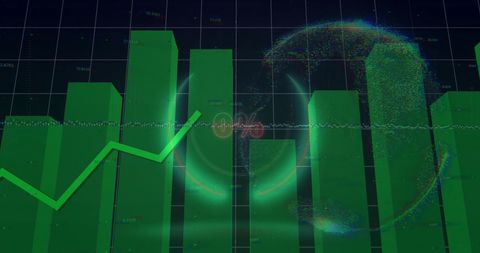
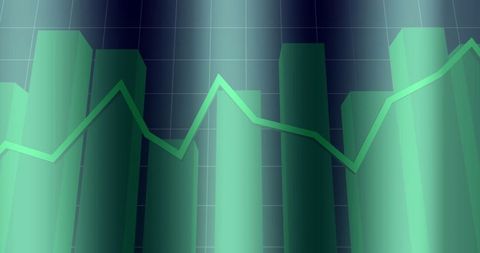
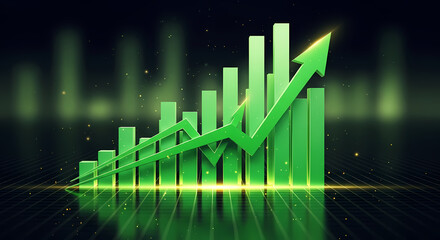
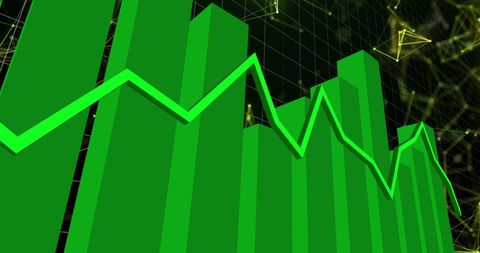
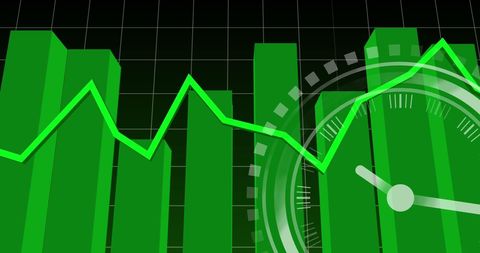
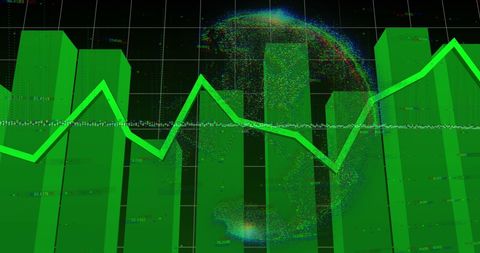
- Digital Green Bar Graph Over Dark Background Illustrating Market Trends
Digital Green Bar Graph Over Dark Background Illustrating Market Trends Image

Illustration features vibrant green bar graph with line graphs over dark background. Suitable for financial presentations, market trend analyses, business reports, and digital content focused on data and analytics. Enhanced visual appeal for explaining complex financial concepts or showcasing upward trends in investments.
Powered by 


2
downloads
downloads
Tags:
More
Credit Photo
If you would like to credit the Photo, here are some ways you can do so
Text Link
photo Link
<span class="text-link">
<span>
<a target="_blank" href=https://pikwizard.com/photo/digital-green-bar-graph-over-dark-background-illustrating-market-trends/eda3ee666528d94ffcf695b28be614bd/>PikWizard</a>
</span>
</span>
<span class="image-link">
<span
style="margin: 0 0 20px 0; display: inline-block; vertical-align: middle; width: 100%;"
>
<a
target="_blank"
href="https://pikwizard.com/photo/digital-green-bar-graph-over-dark-background-illustrating-market-trends/eda3ee666528d94ffcf695b28be614bd/"
style="text-decoration: none; font-size: 10px; margin: 0;"
>
<img src="https://pikwizard.com/pw/medium/eda3ee666528d94ffcf695b28be614bd.jpg" style="margin: 0; width: 100%;" alt="" />
<p style="font-size: 12px; margin: 0;">PikWizard</p>
</a>
</span>
</span>
Free (free of charge)
Free for personal and commercial use.
Author: Creative Art
Similar Free Stock Images
Loading...

Premium


Premium


Premium


Premium


Premium


Premium


Premium


Premium

Premium


Premium


Premium


Premium


Premium


Premium

Premium


Premium


Premium


Premium


Premium


Premium


Premium


Premium


Premium

Premium


Premium