
- Home >
- Stock Photos >
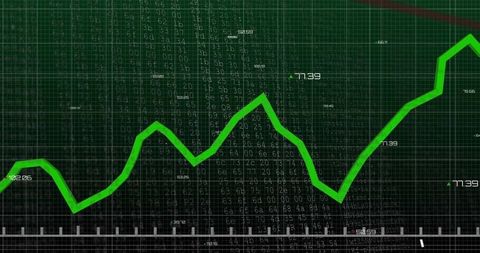
- Digital Green Economy Data Visualization with Floating Numbers
Digital Green Economy Data Visualization with Floating Numbers Image

Digital artwork depicting fluctuating green graph with dots and rising numbers on a black background. Perfect for illustrating themes related to global economy, financial markets, and analytics. Ideal for use in presentations and articles on digital finance and stock market analysis.
Powered by 


downloads
Tags:
More
Credit Photo
If you would like to credit the Photo, here are some ways you can do so
Text Link
photo Link
<span class="text-link">
<span>
<a target="_blank" href=https://pikwizard.com/photo/digital-green-economy-data-visualization-with-floating-numbers/bee12e75acc75bbbb604e37f2e941935/>PikWizard</a>
</span>
</span>
<span class="image-link">
<span
style="margin: 0 0 20px 0; display: inline-block; vertical-align: middle; width: 100%;"
>
<a
target="_blank"
href="https://pikwizard.com/photo/digital-green-economy-data-visualization-with-floating-numbers/bee12e75acc75bbbb604e37f2e941935/"
style="text-decoration: none; font-size: 10px; margin: 0;"
>
<img src="https://pikwizard.com/pw/medium/bee12e75acc75bbbb604e37f2e941935.jpg" style="margin: 0; width: 100%;" alt="" />
<p style="font-size: 12px; margin: 0;">PikWizard</p>
</a>
</span>
</span>
Free (free of charge)
Free for personal and commercial use.
Author: Creative Art
Similar Free Stock Images

Premium


Premium

Premium


Premium


Premium


Premium


Premium


Premium

Premium


Premium


Premium


Premium


Premium


Premium


Premium


Premium


Premium


Premium


Premium


Premium

Premium


Premium

Premium

Premium

Premium

Explore More Free Stock Images