
- Home >
- Stock Photos >
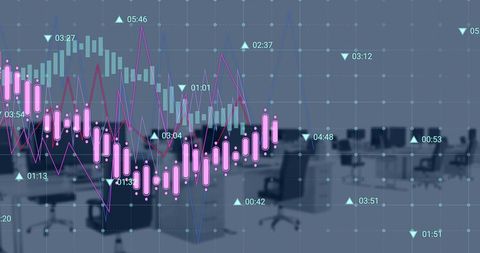
- Digital Grid Displaying Financial Line Graphs and Candlesticks
Digital Grid Displaying Financial Line Graphs and Candlesticks Image

Graphic shows financial data with candlestick charts and line graphs. Elements indicate market trends, progress or tracking in financial technology sectors. Useful for articles or resources about investments, stock markets, analytics, or financial systems development.
Powered by  - Get 15% off with code: PIKWIZARD15


downloads
Tags:
More
Credit Photo
If you would like to credit the Photo, here are some ways you can do so
Text Link
photo Link
<span class="text-link">
<span>
<a target="_blank" href=https://pikwizard.com/photo/digital-grid-displaying-financial-line-graphs-and-candlesticks/df8fc190e717c8ab36a019c2bfd0b448/>PikWizard</a>
</span>
</span>
<span class="image-link">
<span
style="margin: 0 0 20px 0; display: inline-block; vertical-align: middle; width: 100%;"
>
<a
target="_blank"
href="https://pikwizard.com/photo/digital-grid-displaying-financial-line-graphs-and-candlesticks/df8fc190e717c8ab36a019c2bfd0b448/"
style="text-decoration: none; font-size: 10px; margin: 0;"
>
<img src="https://pikwizard.com/pw/medium/df8fc190e717c8ab36a019c2bfd0b448.jpg" style="margin: 0; width: 100%;" alt="" />
<p style="font-size: 12px; margin: 0;">PikWizard</p>
</a>
</span>
</span>
Free (free of charge)
Free for personal and commercial use.
Author: People Creations
Similar Free Stock Images

Premium


Premium

Premium


Premium


Premium


Premium


Premium


Premium

Premium

Premium

Premium


Premium


Premium


Premium


Premium


Premium


Premium


Premium


Premium


Premium


Premium

Premium


Premium


Premium


Premium


Explore More Free Stock Images