
- Home >
- Stock Photos >
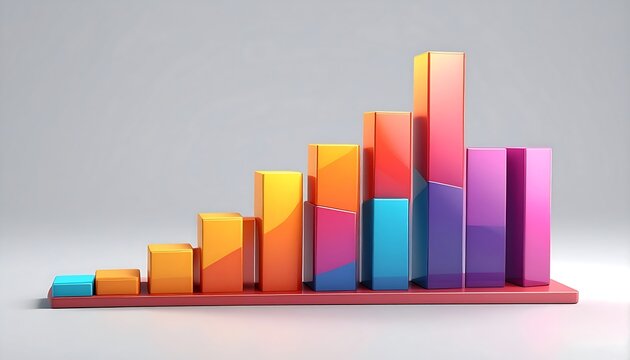
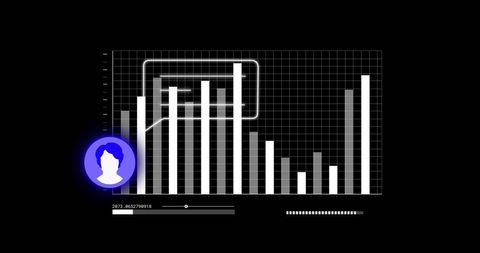
- Digital Growth Metrics with Dynamic Data Visualization
Digital Growth Metrics with Dynamic Data Visualization Image

Graph displaying fluctuating data with digital interface elements, suitable for illustrating technology themes. Great for reports or presentations showcasing growth trends, data analysis, or futuristic business concepts.
Powered by 


downloads
Tags:
More
Credit Photo
If you would like to credit the Photo, here are some ways you can do so
Text Link
photo Link
<span class="text-link">
<span>
<a target="_blank" href=https://pikwizard.com/photo/digital-growth-metrics-with-dynamic-data-visualization/3e5a079b4986cdf9361f632736c95449/>PikWizard</a>
</span>
</span>
<span class="image-link">
<span
style="margin: 0 0 20px 0; display: inline-block; vertical-align: middle; width: 100%;"
>
<a
target="_blank"
href="https://pikwizard.com/photo/digital-growth-metrics-with-dynamic-data-visualization/3e5a079b4986cdf9361f632736c95449/"
style="text-decoration: none; font-size: 10px; margin: 0;"
>
<img src="https://pikwizard.com/pw/medium/3e5a079b4986cdf9361f632736c95449.jpg" style="margin: 0; width: 100%;" alt="" />
<p style="font-size: 12px; margin: 0;">PikWizard</p>
</a>
</span>
</span>
Free (free of charge)
Free for personal and commercial use.
Author: Creative Art
Similar Free Stock Images

Premium


Premium


Premium

Premium


Premium


Premium


Premium

Premium


Premium


Premium

Premium


Premium


Premium


Premium


Premium


Premium


Premium


Premium


Premium


Premium


Premium


Premium


Premium


Premium

Premium


Explore More Free Stock Images