- Home >
- Stock Photos >
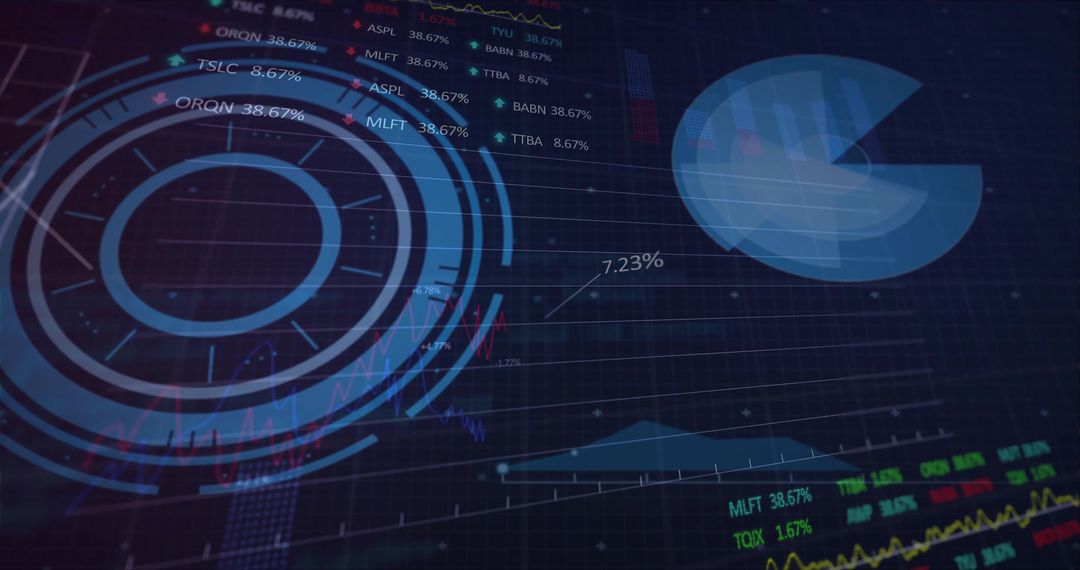
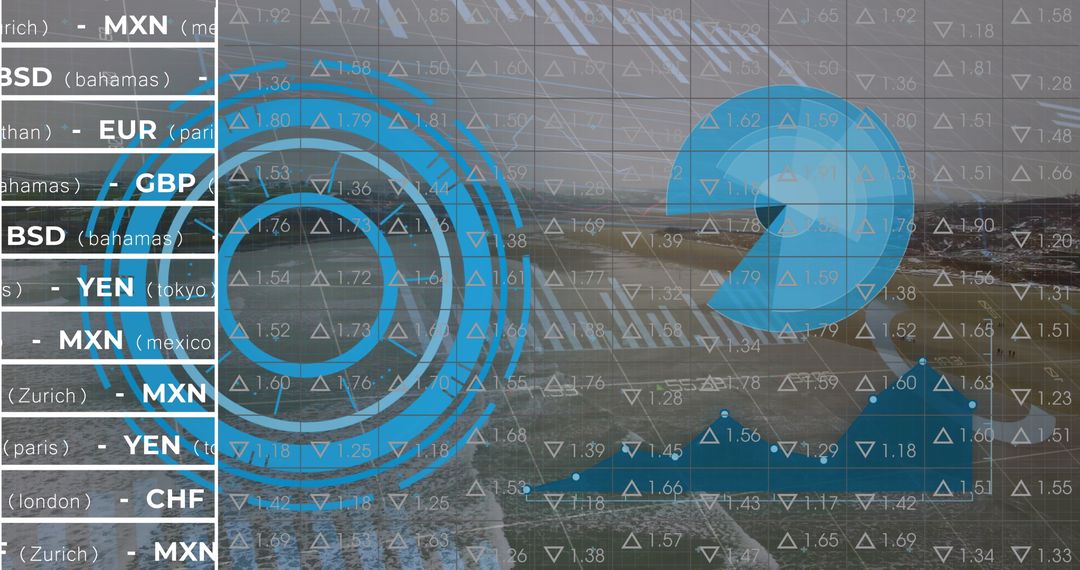
- Digital Hologram Indicators with Financial Data Analysis Concepts
Digital Hologram Indicators with Financial Data Analysis Concepts Image

Abstract visuals of digital holograms and graphs depicting stock market data and financial analysis. Useful for illustrating concepts in business growth, financial data interpretation, and analysis technologies for analytic tools marketing.
Powered by  - Get 15% off with code: PIKWIZARD15


2
downloads
downloads
Tags:
More
Credit Photo
If you would like to credit the Photo, here are some ways you can do so
Text Link
photo Link
<span class="text-link">
<span>
<a target="_blank" href=https://pikwizard.com/photo/digital-hologram-indicators-with-financial-data-analysis-concepts/f3b3bf6e2d1ef509f2db426b93f6489d/>PikWizard</a>
</span>
</span>
<span class="image-link">
<span
style="margin: 0 0 20px 0; display: inline-block; vertical-align: middle; width: 100%;"
>
<a
target="_blank"
href="https://pikwizard.com/photo/digital-hologram-indicators-with-financial-data-analysis-concepts/f3b3bf6e2d1ef509f2db426b93f6489d/"
style="text-decoration: none; font-size: 10px; margin: 0;"
>
<img src="https://pikwizard.com/pw/medium/f3b3bf6e2d1ef509f2db426b93f6489d.jpg" style="margin: 0; width: 100%;" alt="" />
<p style="font-size: 12px; margin: 0;">PikWizard</p>
</a>
</span>
</span>
Free (free of charge)
Free for personal and commercial use.
Author: Creative Art
Similar Free Stock Images

Premium


Premium


Premium


Premium


Premium


Premium


Premium


Premium


Premium


Premium


Premium


Premium


Premium


Premium


Premium


Premium


Premium


Premium


Premium


Premium


Premium


Premium


Premium


Premium