
- Home >
- Stock Photos >
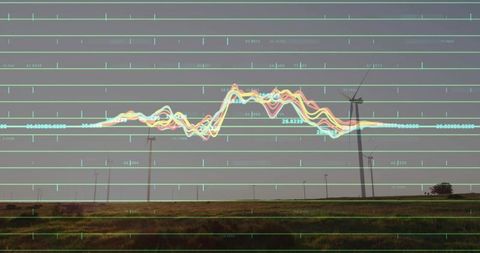
- Digital Holographic Data Interface Display
Digital Holographic Data Interface Display Image

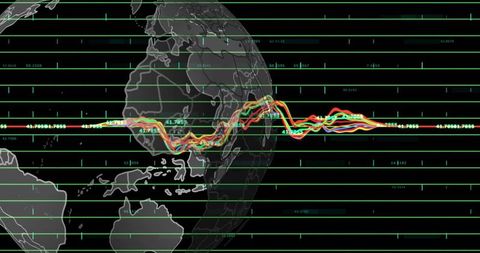
Dynamic graphical representation of data on a rotating globe highlights concepts like globalization, growth, and cutting-edge technologies. Suitable for use in business presentations, tech blogs, or educational content about digital trends and data analysis.
Powered by 


downloads
Tags:
More
Credit Photo
If you would like to credit the Photo, here are some ways you can do so
Text Link
photo Link
<span class="text-link">
<span>
<a target="_blank" href=https://pikwizard.com/photo/digital-holographic-data-interface-display/7783a85060f853d701ab81f70ec10ef9/>PikWizard</a>
</span>
</span>
<span class="image-link">
<span
style="margin: 0 0 20px 0; display: inline-block; vertical-align: middle; width: 100%;"
>
<a
target="_blank"
href="https://pikwizard.com/photo/digital-holographic-data-interface-display/7783a85060f853d701ab81f70ec10ef9/"
style="text-decoration: none; font-size: 10px; margin: 0;"
>
<img src="https://pikwizard.com/pw/medium/7783a85060f853d701ab81f70ec10ef9.jpg" style="margin: 0; width: 100%;" alt="" />
<p style="font-size: 12px; margin: 0;">PikWizard</p>
</a>
</span>
</span>
Free (free of charge)
Free for personal and commercial use.
Author: Awesome Content
Similar Free Stock Images

Premium


Premium

Premium

Premium


Premium

Premium


Premium


Premium


Premium

Premium

Premium


Premium


Premium


Premium

Premium

Premium


Premium


Premium


Premium

Premium


Premium


Premium

Premium


Premium


Premium

Explore More Free Stock Images