1. Home > 
  2. Stock Photos > 
  3. Digital Icons Globe Overlay on Data Chart Background

Digital Icons Globe Overlay on Data Chart Background Image

Digital Icons Globe Overlay on Data Chart Background

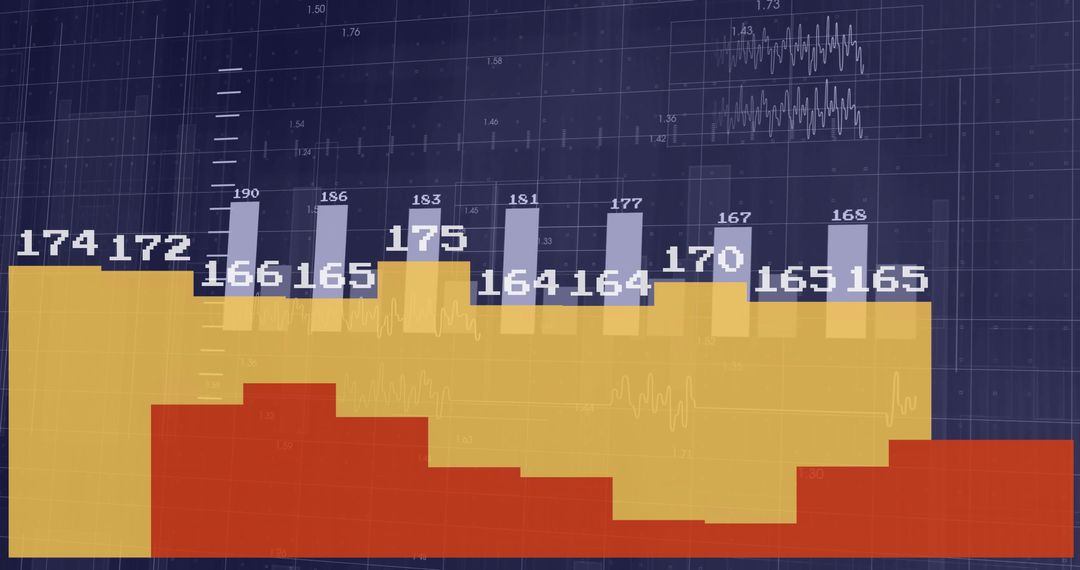
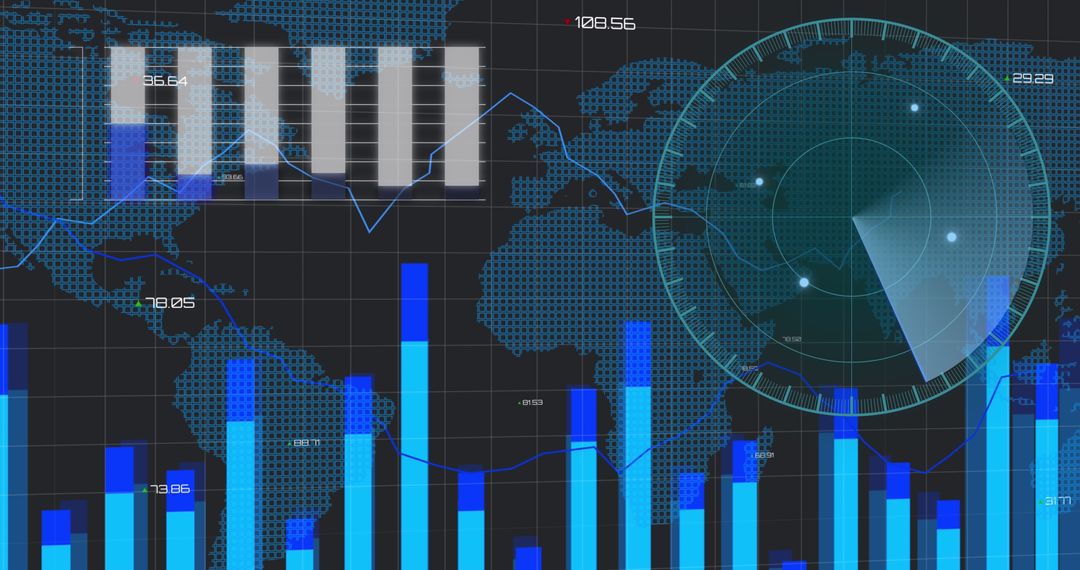
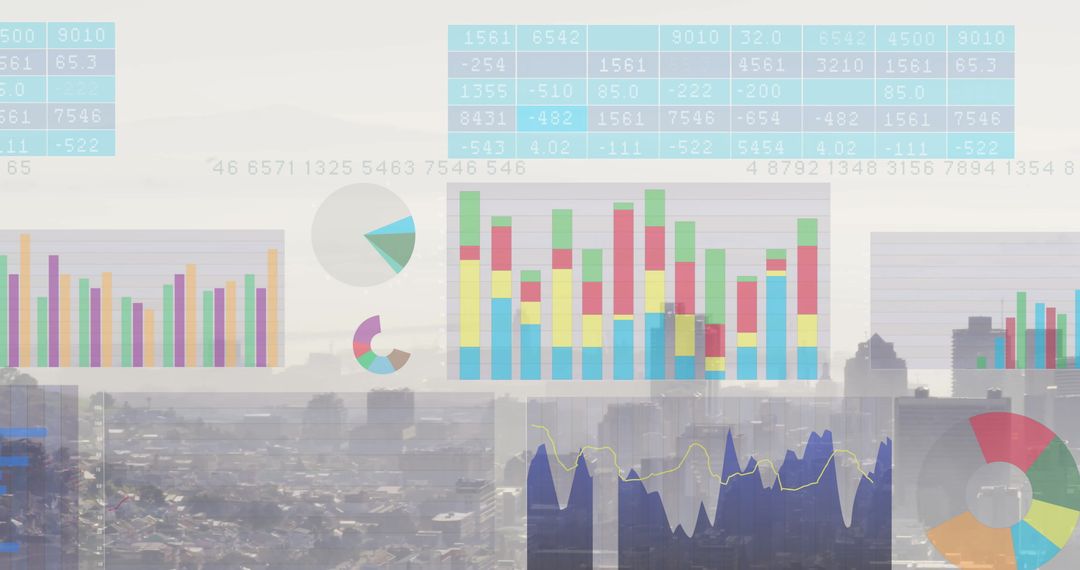
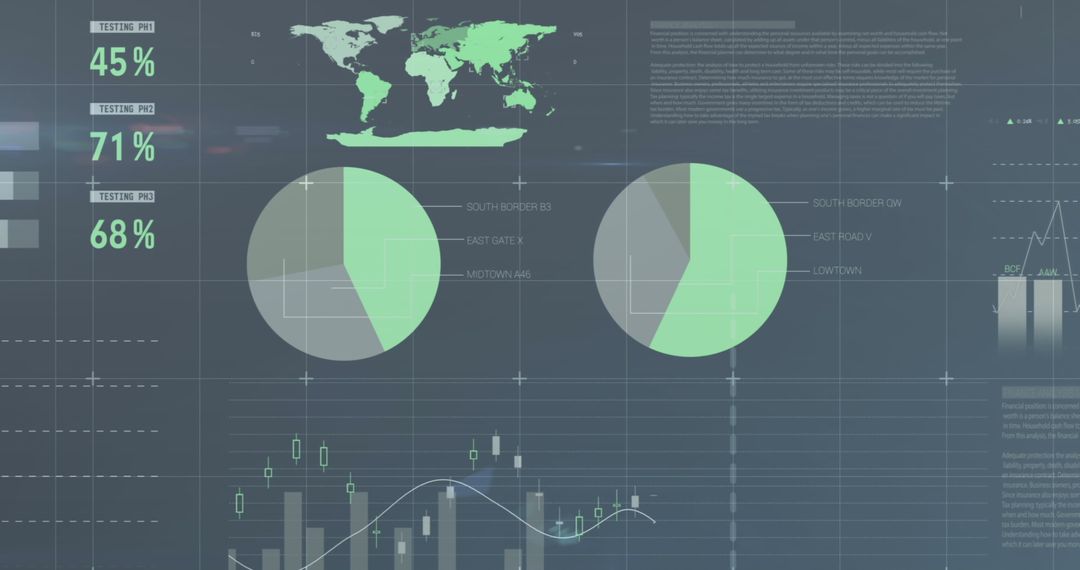
This image showcases a collage of digital technology icons arranged in a globe shape, superimposed on a chart with statistical data bars and light trails. It represents the global reach and intricacy of modern networking and data analytics tools, highlighting the intersection of technology and business. Ideal for use in presentations, business reports, technology blogs, and marketing materials focused on innovation and global communication strategies.

Powered by Shutterstock logo - Get 15% off with code: PIKWIZARD15
AI, Big Data, and business analytics icons represent the integration of advanced technology in analyzing graphs, business data, and market trends, driving strategic decisions and innovative solutions. - Powered by Shutterstock - Get 15% off with code: PIKWIZARD15AI, Big Data, and business analytics icons represent the integration of advanced technology in analyzing graphs, business data, and market trends, driving strategic decisions and innovative solutions. - Powered by Shutterstock - Get 15% off with code: PIKWIZARD15Displaying dashboard showing pie, bar, line and candlestick charts with percentage labels on screen. Futuristic, analytics, technology, innovation, data, interface, visualization - Powered by Shutterstock - Get 15% off with code: PIKWIZARD15Displaying red-gray pie chart on screen with world map metrics bar-chart line-chart and icons. Data visualization, dashboard, analytics, intelligence, metrics, technology, statistical - Powered by Shutterstock - Get 15% off with code: PIKWIZARD15Showing green line chart fluctuating on dashboard, with map pins, thumbs-up, heart and mail icons. Data visualization, financial analysis, performance metrics, digital interface, data-driven, - Powered by Shutterstock - Get 15% off with code: PIKWIZARD15

Credit Photo

If you would like to credit the Photo, here are some ways you can do so

Free (free of charge)

Free for personal and commercial use.

Author: Awesome Content

Similar Free Stock Images

Financial Data Dynamics with Stormy Weather Visuals
Premium
Displaying dashboard plotting red and blue line charts in analytics interface, with social icons. Data visualization, dashboard, analytics, user interface, finance, digital, metrics
Financial Charts with Upward Trend and Analysis Tools
Financial Market Trends on Russian Flag Background
Digital Representation of Financial Analytics with Graphs and Charts
Data Visualization Merging Digital Text and Cityscape Drawing
Premium
Dashboard Application on screen with businessman analytics data, charts and graphics
Abstract Financial Graph Display on Dark Background
Visualization of Financial Data Over Modern Office Desk
Financial Graph and Data Overlay on Ukraine Flag
Vibrant Bar Graph and Digital Data Analysis Interface
Premium
Analyzing Return on Investment (ROI) Concept. Businessman holding a magnifying glass with ROI and various financial icons, representing the analysis of return on investment and financial performance.
Digital Data Analysis with Graphs and Analytics Tools
Dynamic Interface Displaying Real-Time Statistical Data Charts
Global Financial Data Visualization with World Map and Graphs
Global Data Analysis with Rising Graphs and World Map
Premium
AI, Big Data, and business analytics icons represent the integration of advanced technology in analyzing graphs, business data, and market trends, driving strategic decisions and innovative solutions.
Digital Financial Data and Analytics Interface on Red Background
Statistical Data Processing Interface with Blue Background
Plexus Networks with Statistical Data on Blue Background
Futuristic Data Interface with Analytics and Holographic Face
Premium
A business professional interacts with a smartphone and laptop amidst a digital network, illustrating technology and modern data visualization in a sleek environment. Tessel
Digital Data Visualization with Global Network Connections
Colorful Stacked Bar Chart with Data Analysis Elements
Global Data Analytics with World Map and Graphs
Financial Data and Bar Graphs on Digital Interface Background
Premium
AI agent interface on virtual screen showing chatbot interaction, dashboard analytics, and user profile, representing a smart digital assistant in modern technology.
Futuristic Data Processing with Bar Graph and Digital Interface
Global Network and Technology Communication Concept Background
Layered Bar Chart on Digital Dashboard with Data Analysis Report
Global Data Visualization with Interactive Graphs and Network Nodes
Dynamic Data Visualization of COVID-19 Statistics
Digital Financial Data Dashboard with Bar and Line Graphs
Premium
Hand with magnet attracting social media icons from laptop screen. Contemporary art. Visual for influencer marketing platforms to attract content creators. Digital marketing, online services concept
Dynamic Global Financial Technology Visualization
Digital Graphs and Charts on Tech Background Illustrating Data Analysis
Digital Network Grid with Data Processing
Global Financial Data Analytics and Economic Graphs
Premium
Close-up of hands typing on a keyboard with virtual digital icons, data analytics charts, and cloud computing interface, representing technology, big data, and business innovation.
Colorful Data Charts and Graphics on White Background
Digital Interface Displaying Cybersecurity Data Charts Analysis
Futuristic Data Processing and Analysis Interface
Abstract Financial Data Visualization and Growth Concept
Premium
A modern healthcare dashboard interface with data charts, doctor profiles, and medical icons overlaid on a soft blue digital background. Connected by glowing network lines,
Futuristic Data Analytics Interface with Graphics
Abstract Financial Data Analysis with World Map Background
Dynamic Financial Data Analysis with Mathematical Equations
Global Data Visualization with Digital World Map and Graphs
Premium
Diverse Team Collaborating with AI Tools in a Modern Office Meeting Room. Top Down View Highlighting Dynamic Interaction and Advanced Technology Integration with Holographic Interfaces
Global Finance Analytics with Data Visualization Elements
Global Financial Data with Bar Graphs and Map
Data Analytics Dashboard with Dynamic Charts and Graphs
Futuristic Financial Data Interface with Graphs and Binary Code
Premium
A hand interacts with an advanced AI data visualization interface that showcases various elements such as charts, graphs, and security icons, depicting modern technology. Gantry
Digital Financial Chart with Stock Market Data and Analytics
High-Tech Financial Data Visualization Over Desktop
Digital Data Visualizations and Graph Analysis on Dark Interface
Abstract Data Visualization on Purple Background
Premium
Data visualization floating in abstract digital environment, with bar charts, line chart and gauges. Analytics, dashboard, infographic, digital, technology, metrics, statistical
Global Data Trends and Analytics Visualized Over World Map
Abstract Data Interface with World Map and Bar Charts
Futuristic World Map Technology Data Interface
Global Data Analytics with World Map and Bar Graph
Data Analytics and Statistics Display Over Digital Interface
Abstract Financial Analysis Data Display with Orange Vintage Overlay
Premium
Beautiful Woman Using Smartphone on a City Street at Night. Businesswoman Using Mobile Phone, Infographics Show Productivity, Economics, e-Commerce, Finance, Statistics Graphs, Stock Market Data
Digital Marketing Analytics with High-Tech Interface
Colorful Data Visualization Over Digital Background
Global Data Processing with Dynamic Graphs Overlay
Futuristic Digital Screen with Global Financial Data Visualization
Premium
Businessman's hands display large online data on cloud to analyze business technology. cloud business development concept
Data Analytics Charts on Digital Interface
Abstract Data Analysis and Digital Interface
Digital Interface and Data Visualization Concept
Futuristic Infographic Commissioning Data Analysis with Graphics
Premium
Big Data Network Visualization Interconnected Nodes Representing Data Analytics Across a Complex Network Infrastructure. Network Nodes Converting Diverse Data Sources into a Unified Big Data Platform.
Statistical Data Analysis Overlaid on World Map
Financial Data Analysis Display with Colorful Graphs
Digital Interface Displaying Data Analytics in Modern Office
Digital Finance Analytics in Modern Business Environment
Premium
Image of like icons with increasing numbers against mid section of woman using smartphone. Social media networking and business technology concept
Digital Financial Data Analytics with Global Charts and Currencies
Multi-Screen Statistical Data Processing Display
Abstract Financial Data Overlaying Urban Skyline
Global Cryptocurrency Market Analysis and Bitcoin Growth
Premium
Digital Compliance Quality concept with a businessman holding glowing virtual chart in his palm, showing rising financial data, analytics icons, and investment growth for corporate success.
Digital Data Analysis Over World Map Illustrating Global Connections
Dynamic Bar Graph with Downward Trend on Red Grid Background
Digital Financial Data Processing with Code Lines
Digital Financial Data Interface Against City Background
Premium
Displaying area chart with peaks on digital chalkboard, with binder icons and pie‐chart segment. Analytics, data visualization, infographics, educational, scientific, dashboard, mathematical
Futuristic Digital Analytics Dashboard with Graphs and Charts
Neon analytics dashboard displaying stacked bar charts, line graphs and percentage metrics
Abstract Financial Chart on Gradient Background
Global Financial Data Analytics Concept with Blue Graphs
Digital Vehicle Data Dashboard with Charts and Analytics
Abstract Digital Interface: Global Data Visualization
Premium
Showing red bar chart falling on blue grid dashboard, featuring dotted trend arrow and virus icons. Data visualization, analytics, digital interface, holographic, infographics, business intelligence,
Visualizing Stock Market and Data Analytics Trends
Dynamic Financial Data Representation on Purple Gradient
Digital Interface with Graphs and World Map in Blue Tones
Futuristic Data Center with Cloud Computing Concept
Premium
Displaying finance dashboard on dark themed GUI, with vertical bar chart and curved line graph. Data analytics, finance, investment, data visualization, technology, dashboard, digital interface
Financial Data Analysis with Abstract Digital Overlay
Financial Data Processing with Bar Charts and Line Graphs
Abstract Interface Displaying Colorful Data Visualizations
Global Financial Data and Statistics with Blue World Map Overlay
Premium
engineer or businessman Show cloud network system for industrial exchange Future technology of artificial intelligence industrial cloud technology concept
Digital Financial Data Analysis and Graphical Mindset
Composite Business Charts with Cafes Interior
Financial Data Analysis with Stock Market Trends and Graphs
Global Data Analytics and Network Visualization on Digital Grid
Premium
Abstract Business Intelligence and Financial Data Visualization Concept with Hand Interacting with Digital Screen
Financial Data and Stock Market Decline Visualization
Belgium Flag Overlay on Financial Data and Charts
Colorful Graph with Digital Finance Interface and Data Overlay
Global Financial Data and Stock Market Visualization
Premium
Person typing on laptop with AI data visualization, charts, and analytics icons, representing artificial intelligence, business data analysis, and digital productivity concept.
Global Financial Data Visualizations with Charts and World Map
Global Finances and Data Analysis with World Map Overlay
Futuristic Digital Analytics and Global Financial Data Visualization
Futuristic Financial Data Analysis with Candlestick Visualization
Premium
technology, data, analytics, Abstract blue background with cloud data icons and digital network, representing technology analytics, cloud computing, and big data visualization in modern business.
Futuristic trading dashboard with turquoise chat bubbles and real-time analytics overlay