- Home >
- Stock Photos >
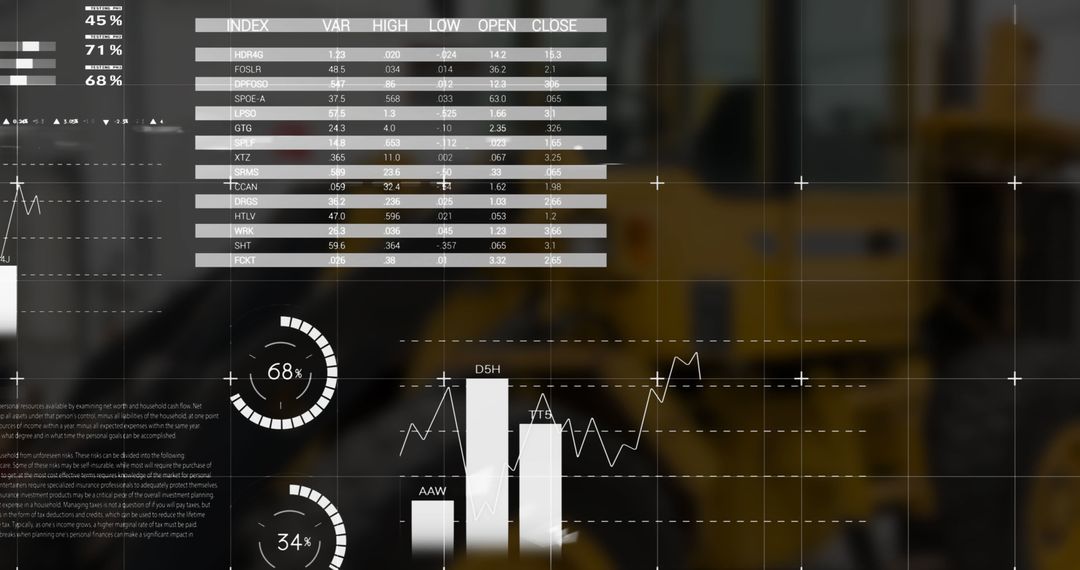
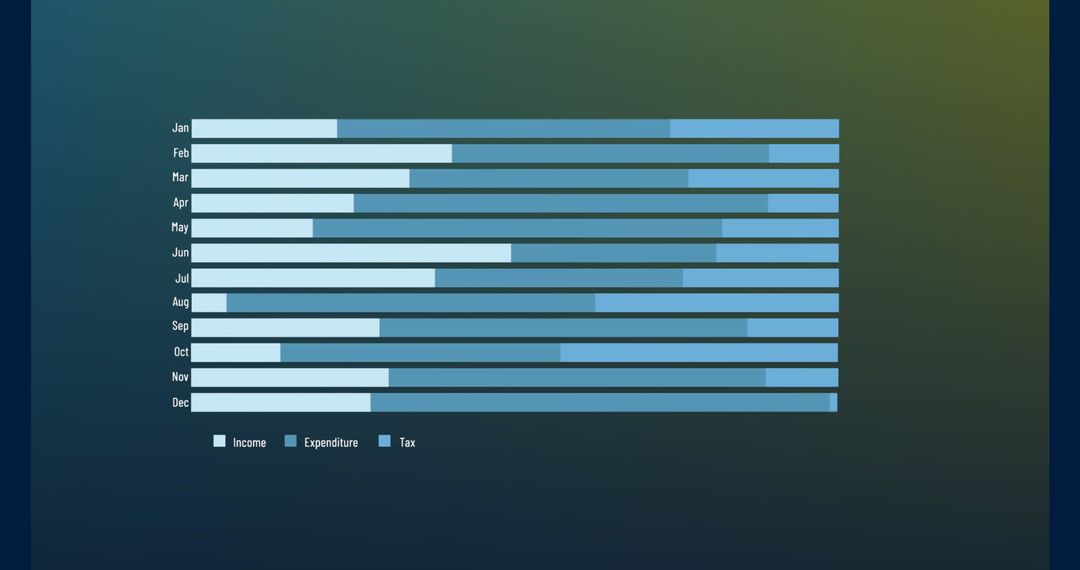
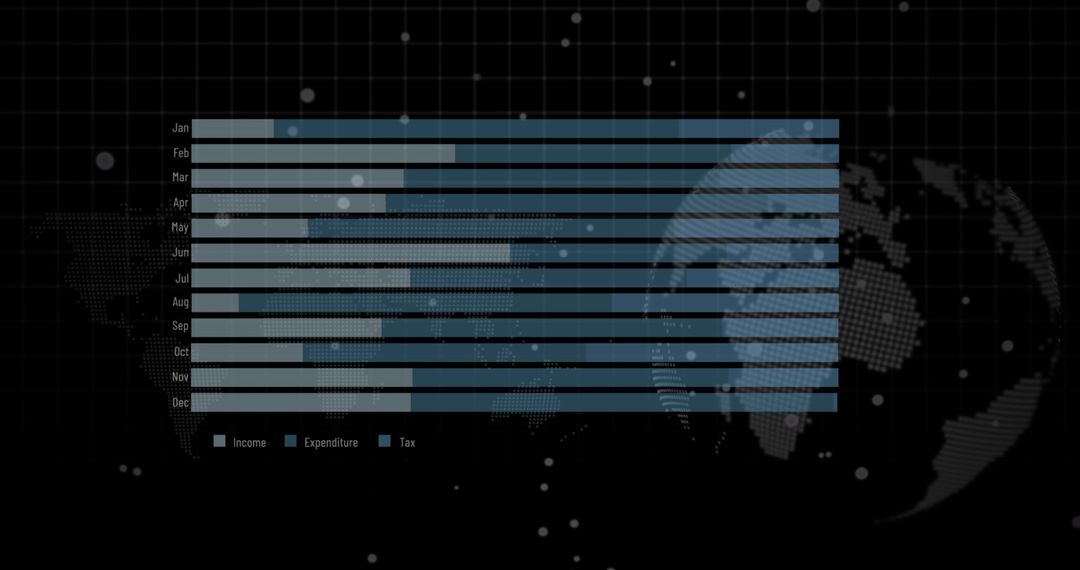
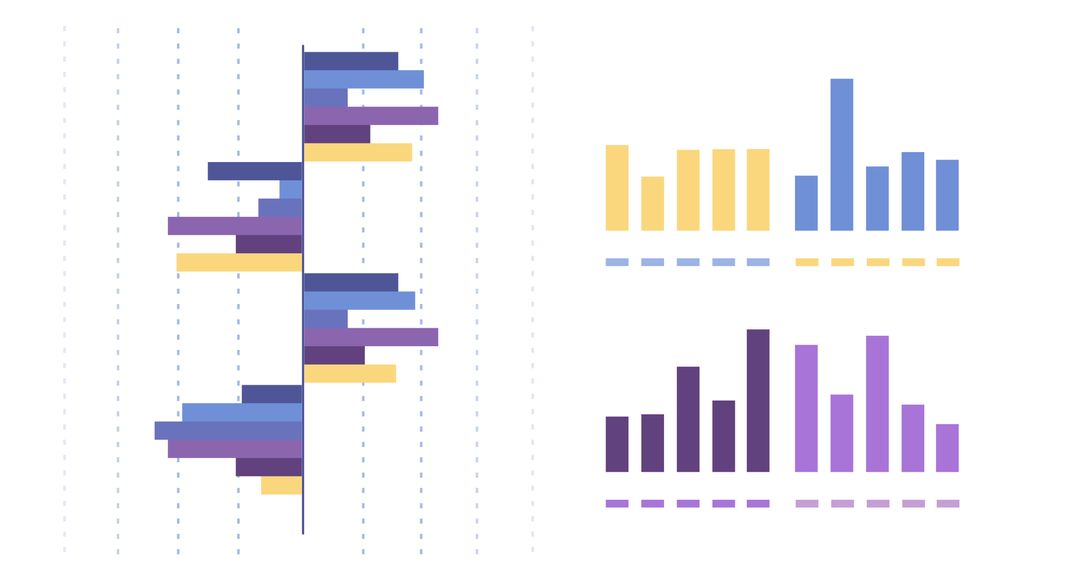
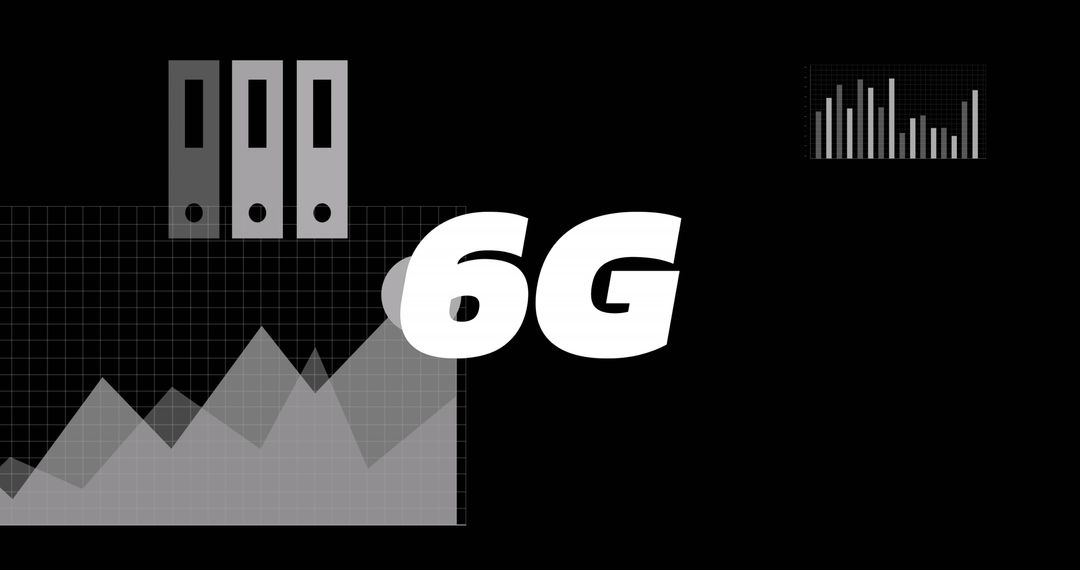
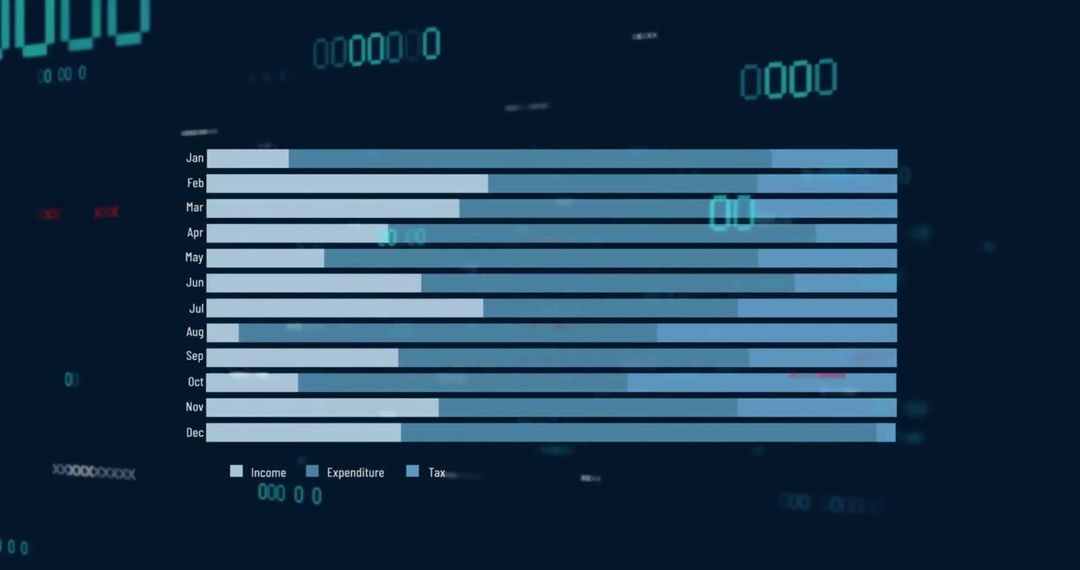
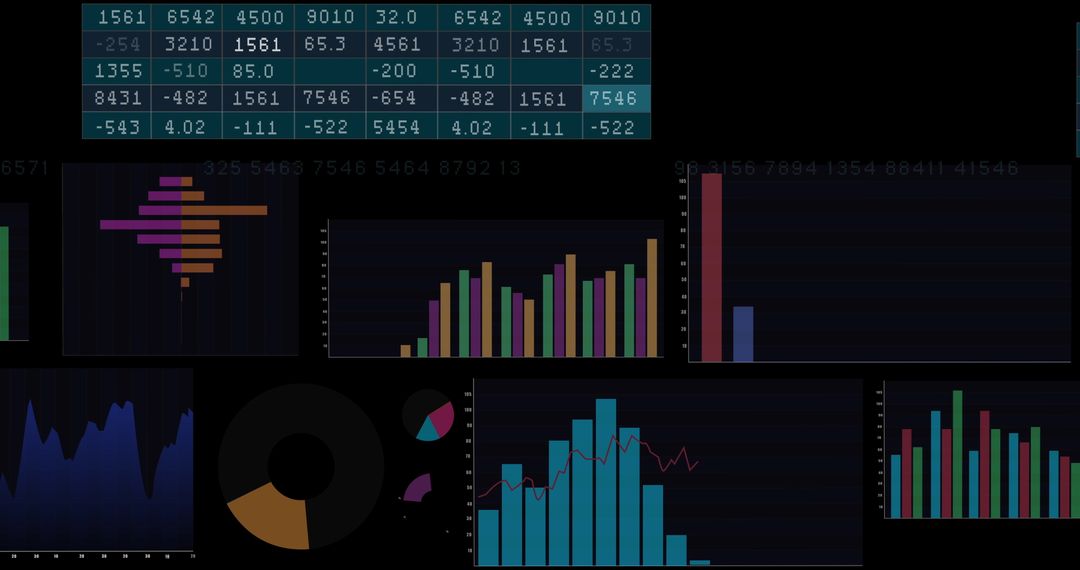
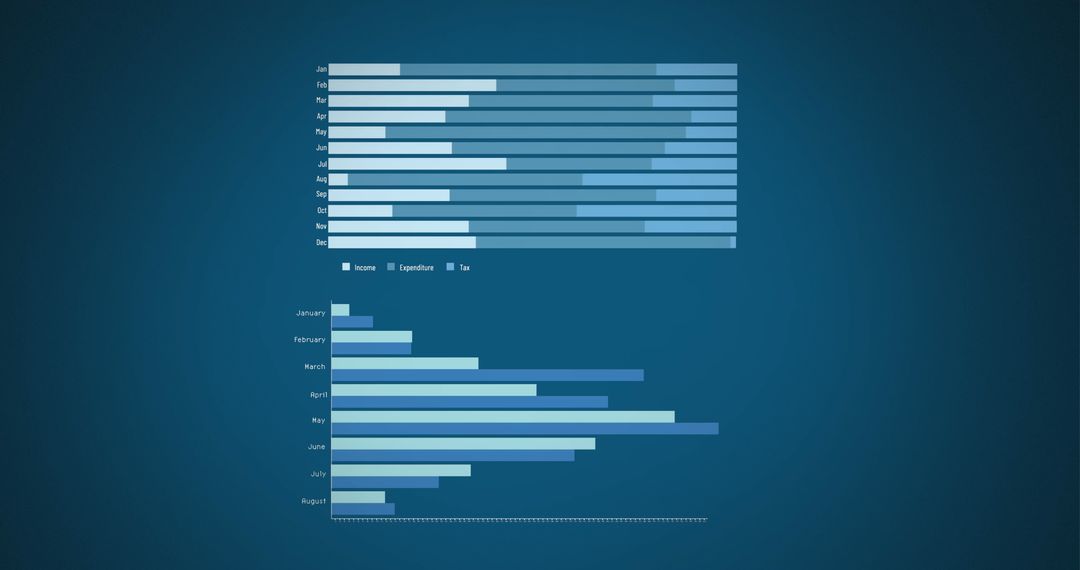
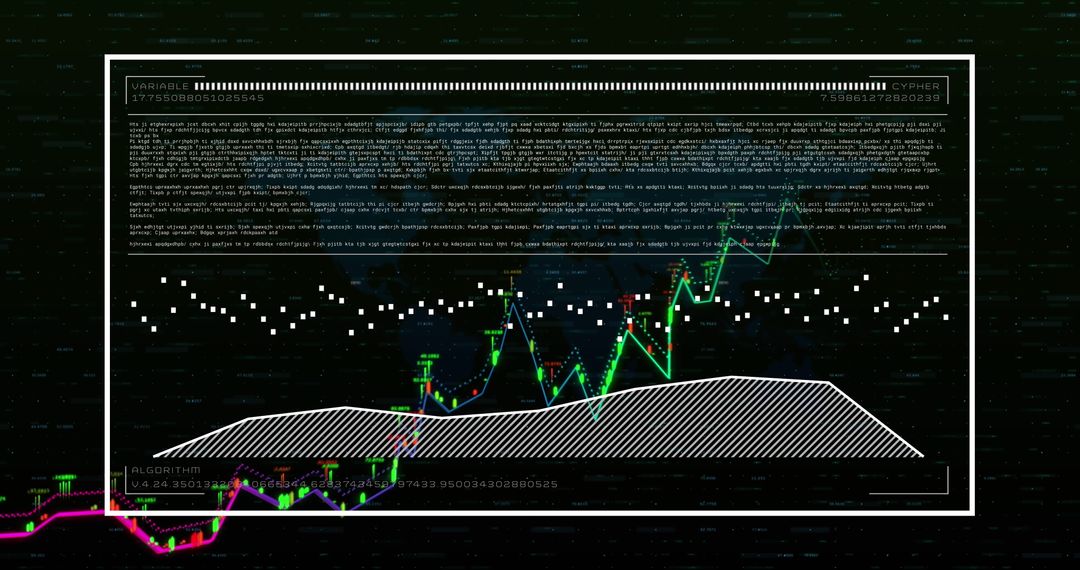
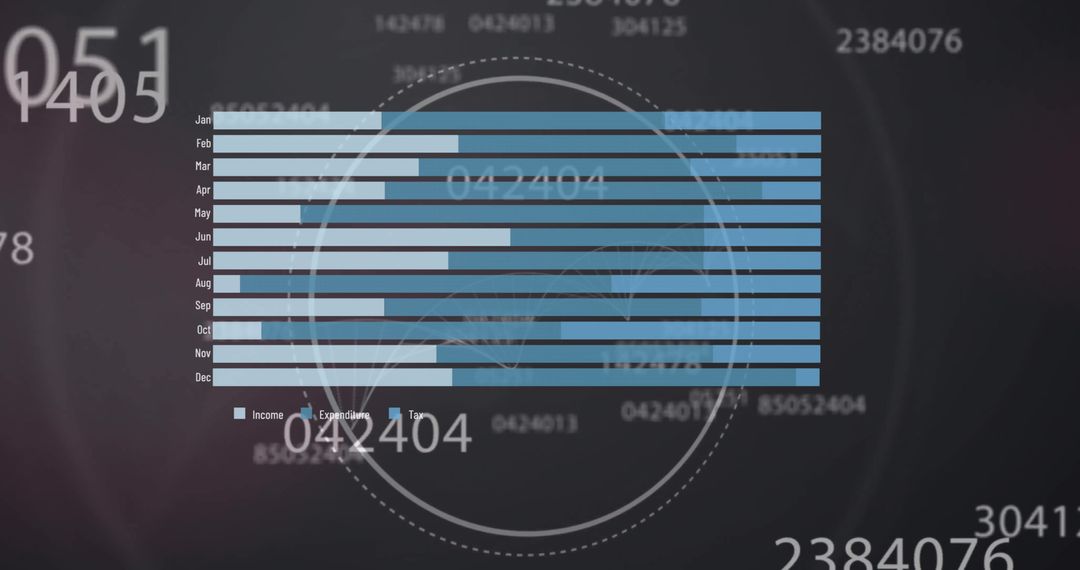
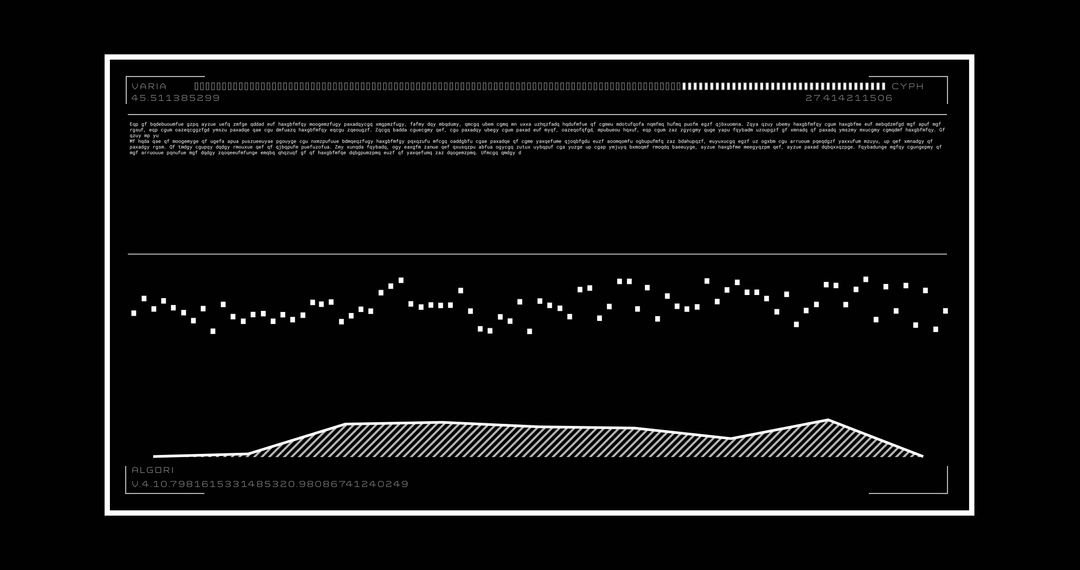
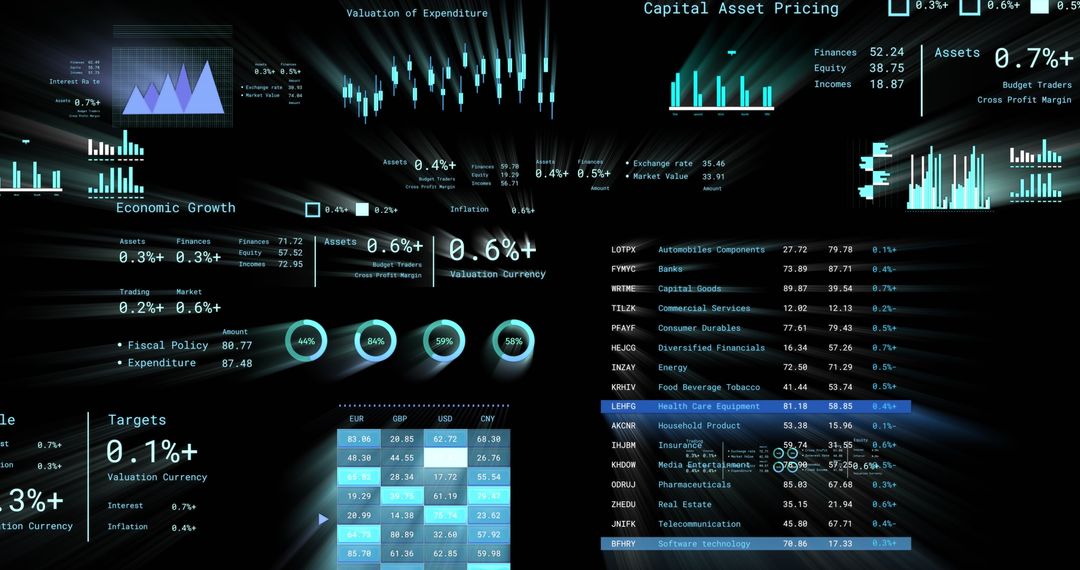
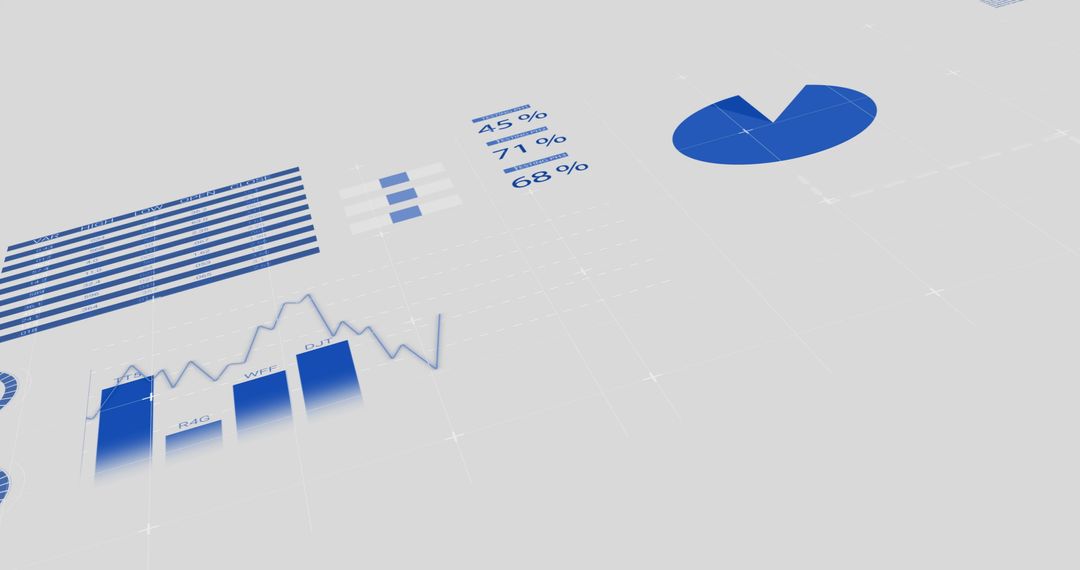
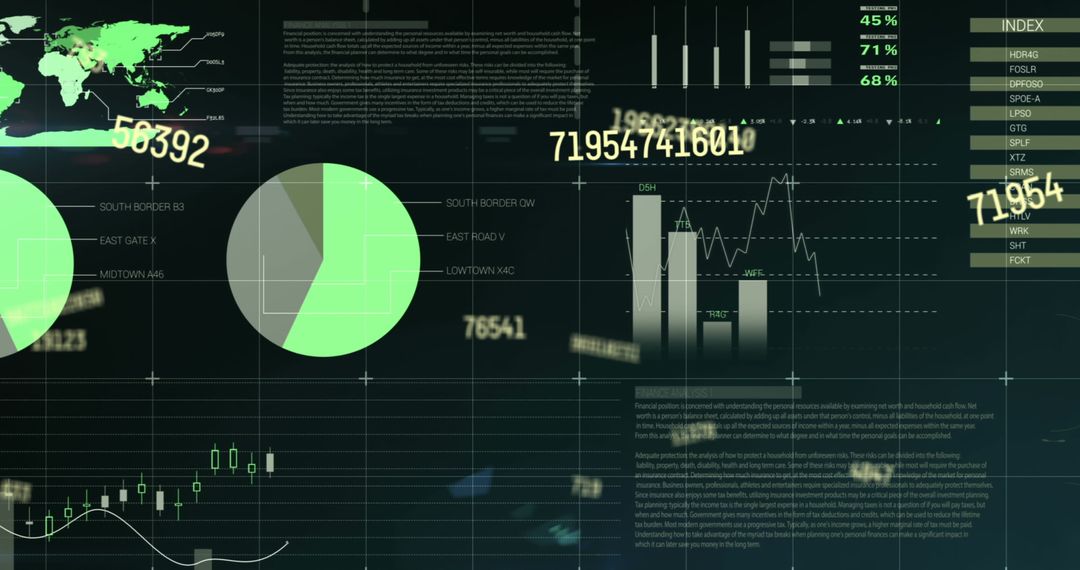
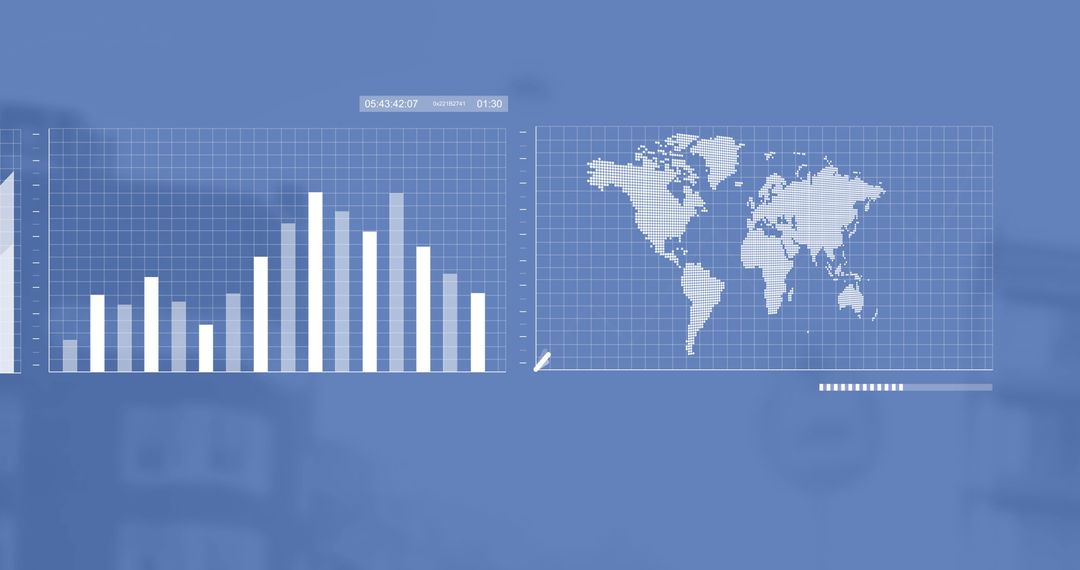
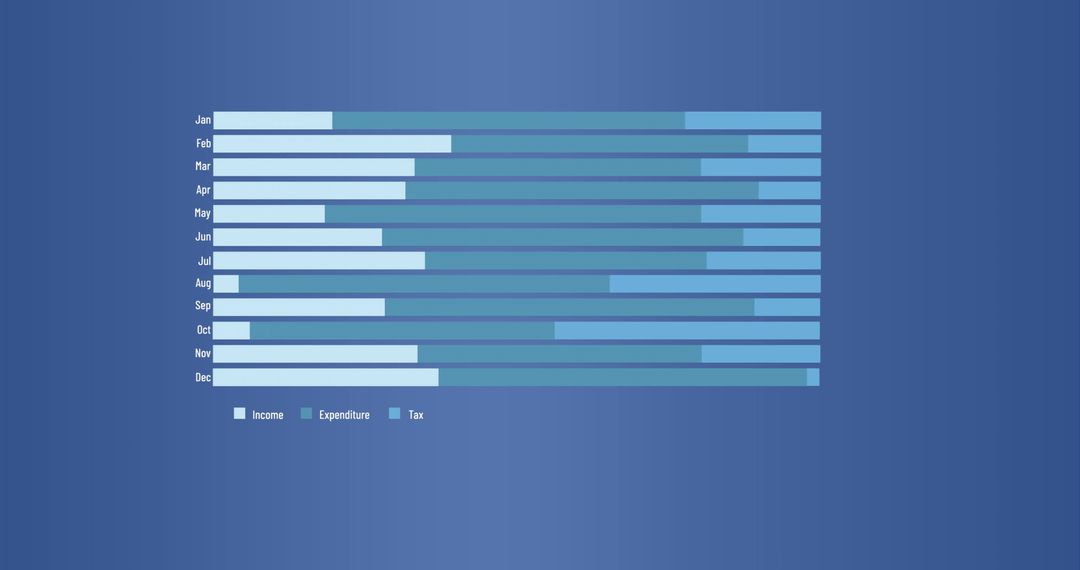
- Digital Income, Expenditure, and Profits Bar Chart Analytics
Digital Income, Expenditure, and Profits Bar Chart Analytics Image
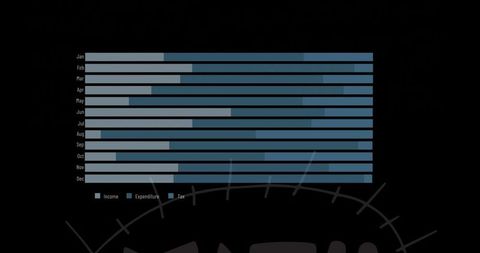
Simplified bar chart displays monthly income, expenditure, profits on black background for easy visualization in financial presentations or economic reports. Ideal for businesses to showcase annual financial trends or digital marketers discussing fiscal strategies.
Powered by 


2
downloads
downloads
Tags:
More
Credit Photo
If you would like to credit the Photo, here are some ways you can do so
Text Link
photo Link
<span class="text-link">
<span>
<a target="_blank" href=https://pikwizard.com/photo/digital-income-expenditure-and-profits-bar-chart-analytics/0313a2ff13fd30242a71425e335a5e2f/>PikWizard</a>
</span>
</span>
<span class="image-link">
<span
style="margin: 0 0 20px 0; display: inline-block; vertical-align: middle; width: 100%;"
>
<a
target="_blank"
href="https://pikwizard.com/photo/digital-income-expenditure-and-profits-bar-chart-analytics/0313a2ff13fd30242a71425e335a5e2f/"
style="text-decoration: none; font-size: 10px; margin: 0;"
>
<img src="https://pikwizard.com/pw/medium/0313a2ff13fd30242a71425e335a5e2f.jpg" style="margin: 0; width: 100%;" alt="" />
<p style="font-size: 12px; margin: 0;">PikWizard</p>
</a>
</span>
</span>
Free (free of charge)
Free for personal and commercial use.
Author: Awesome Content
Similar Free Stock Images

Premium


Premium


Premium


Premium

Premium

Premium


Premium


Premium


Premium


Premium


Premium


Premium


Premium


Premium


Premium


Premium


Premium


Premium


Premium


Premium


Premium

Premium


Premium


Premium