- Home >
- Stock Photos >
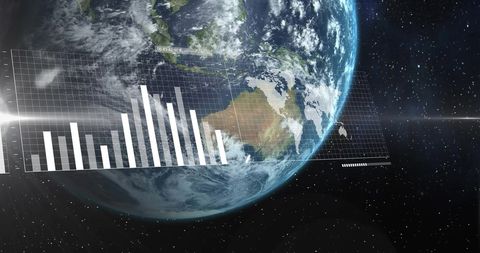
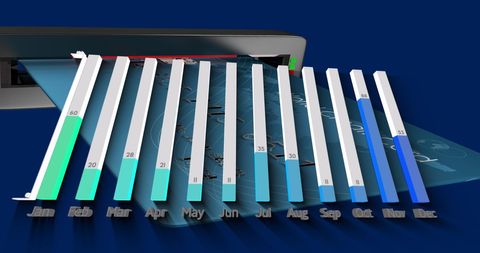
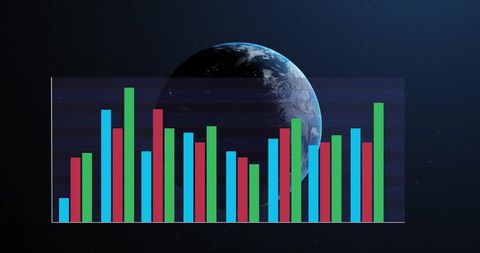
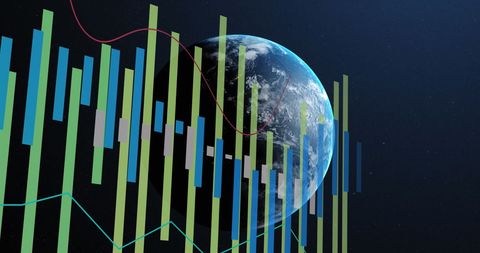
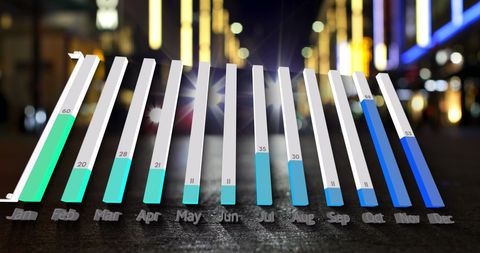
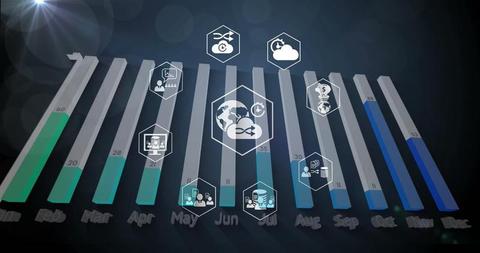
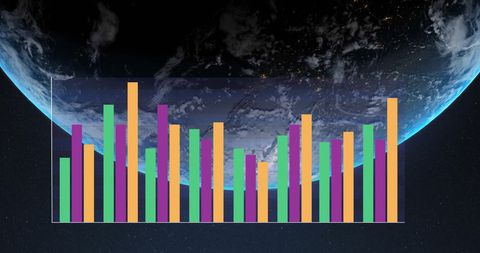
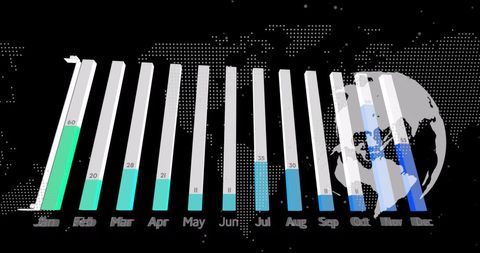
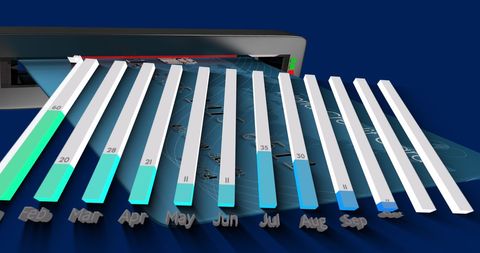
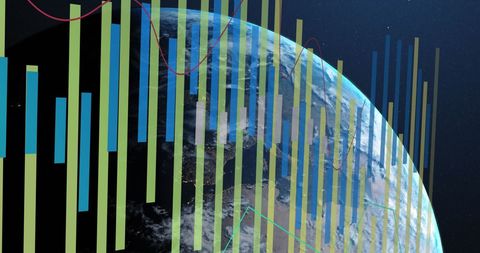
- Digital Infographic on Global Data Over Planet Earth
Digital Infographic on Global Data Over Planet Earth Image

Creative representation of monthly data statistics displayed over an image of Earth, illustrating global business or environmental data in a digital format. Useful for presentations, reports, and marketing materials focused on analytics, environmental conservation, and global business initiatives.

downloads
Tags:
More
Credit Photo
If you would like to credit the Photo, here are some ways you can do so
Text Link
photo Link
<span class="text-link">
<span>
<a target="_blank" href=https://pikwizard.com/photo/digital-infographic-on-global-data-over-planet-earth/9be8367fde27d50fb0792ffddf09cecc/>PikWizard</a>
</span>
</span>
<span class="image-link">
<span
style="margin: 0 0 20px 0; display: inline-block; vertical-align: middle; width: 100%;"
>
<a
target="_blank"
href="https://pikwizard.com/photo/digital-infographic-on-global-data-over-planet-earth/9be8367fde27d50fb0792ffddf09cecc/"
style="text-decoration: none; font-size: 10px; margin: 0;"
>
<img src="https://pikwizard.com/pw/medium/9be8367fde27d50fb0792ffddf09cecc.jpg" style="margin: 0; width: 100%;" alt="" />
<p style="font-size: 12px; margin: 0;">PikWizard</p>
</a>
</span>
</span>
Free (free of charge)
Free for personal and commercial use.
Author: Awesome Content