- Home >
- Stock Photos >
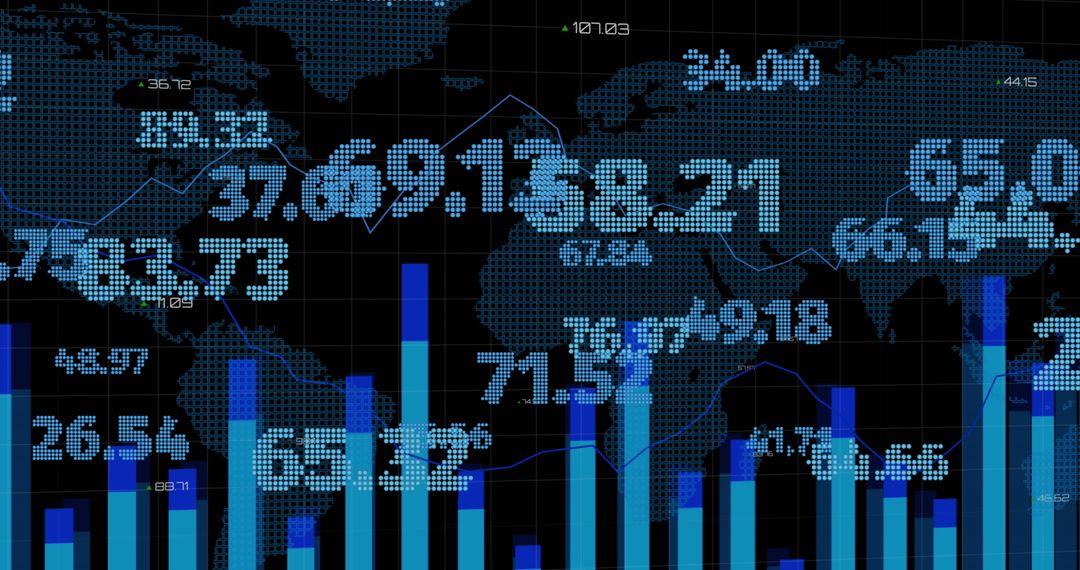
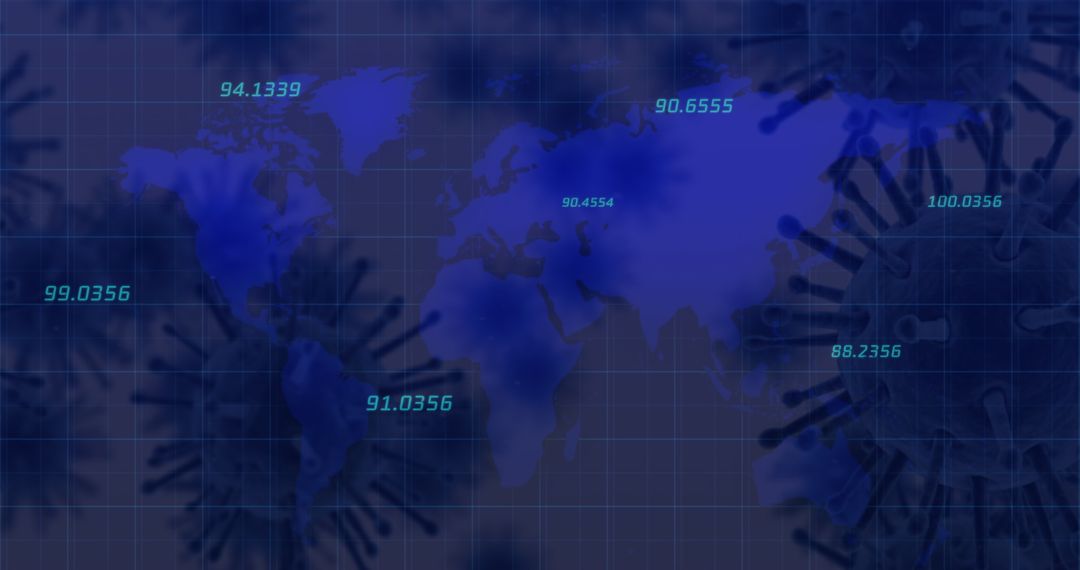
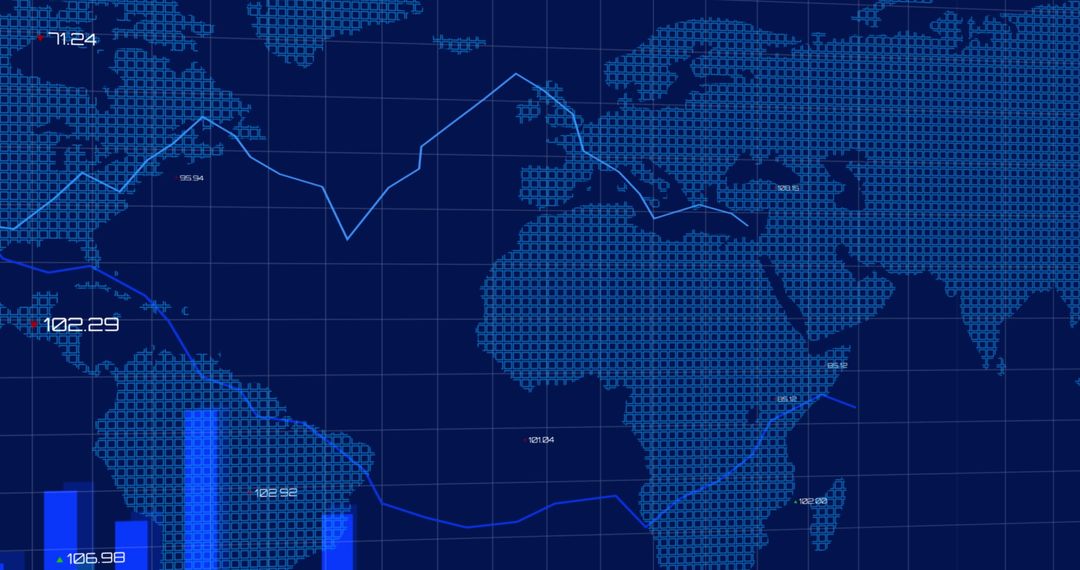
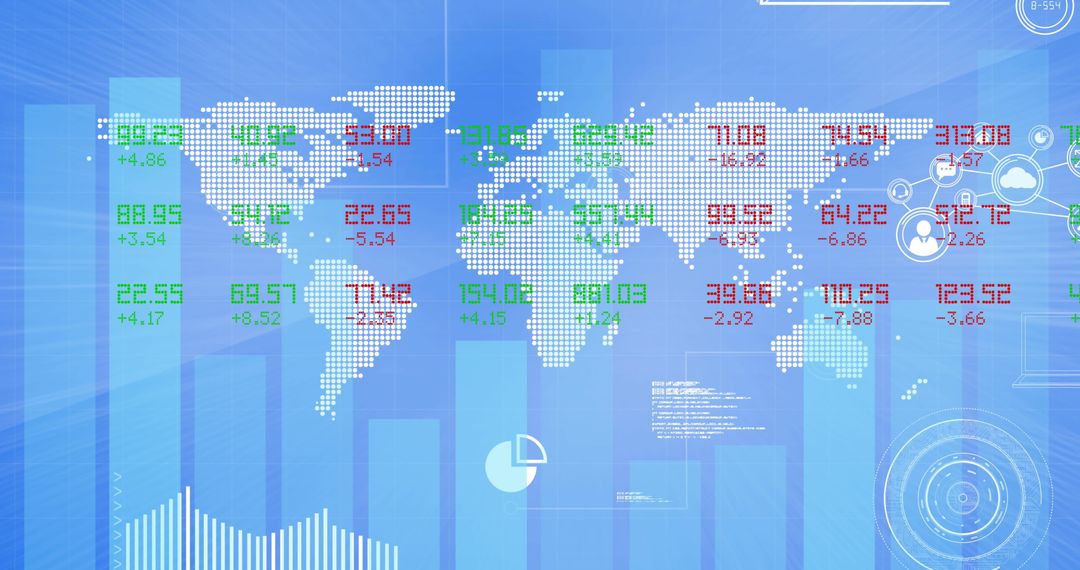
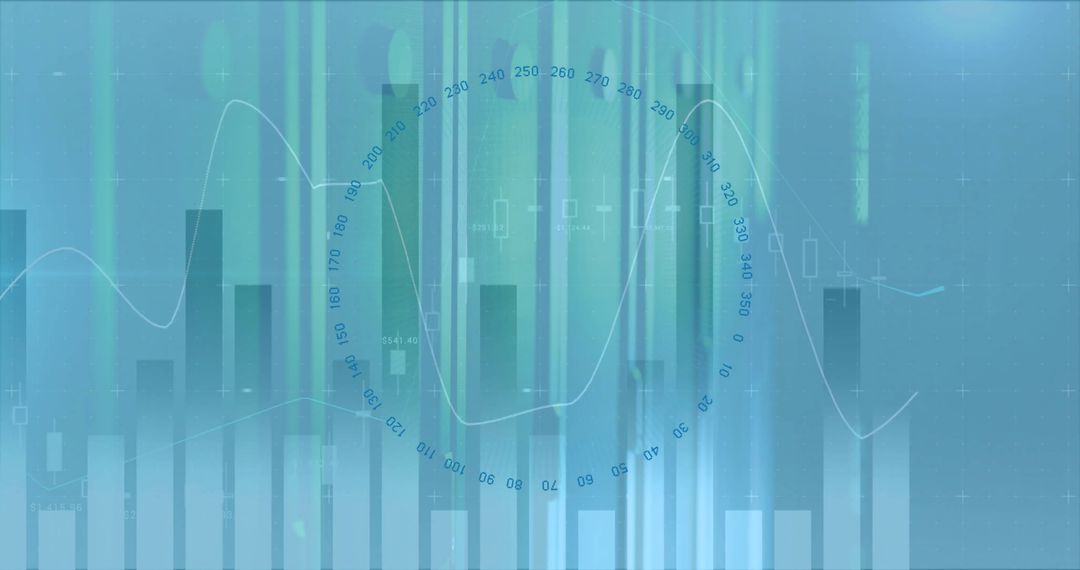
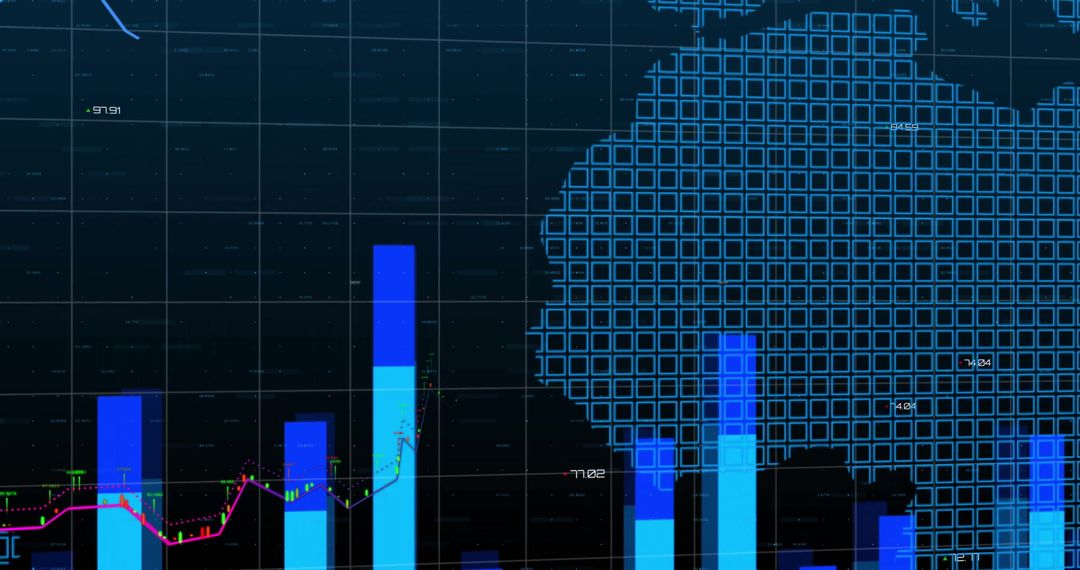
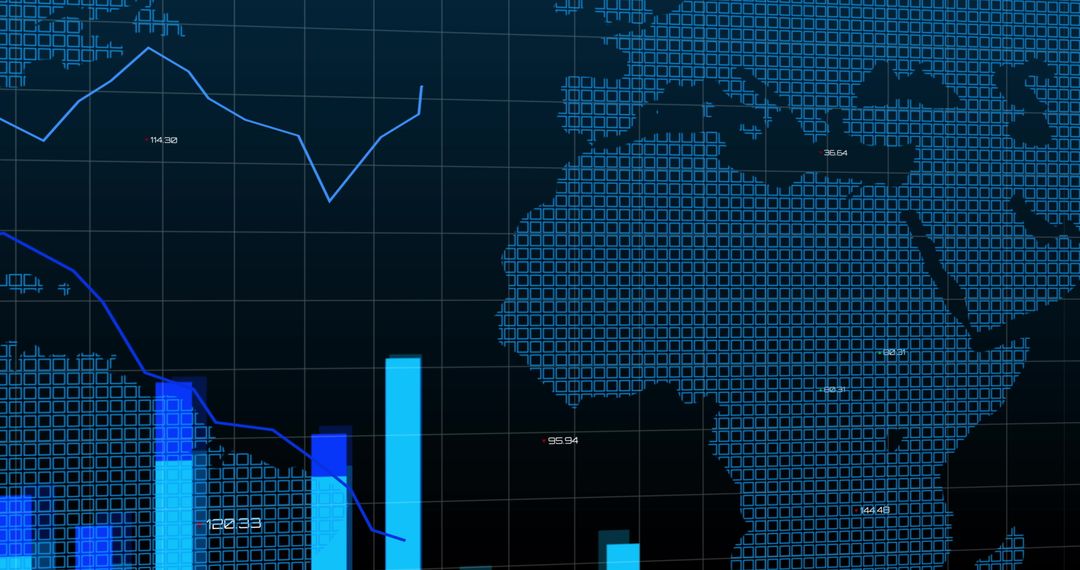
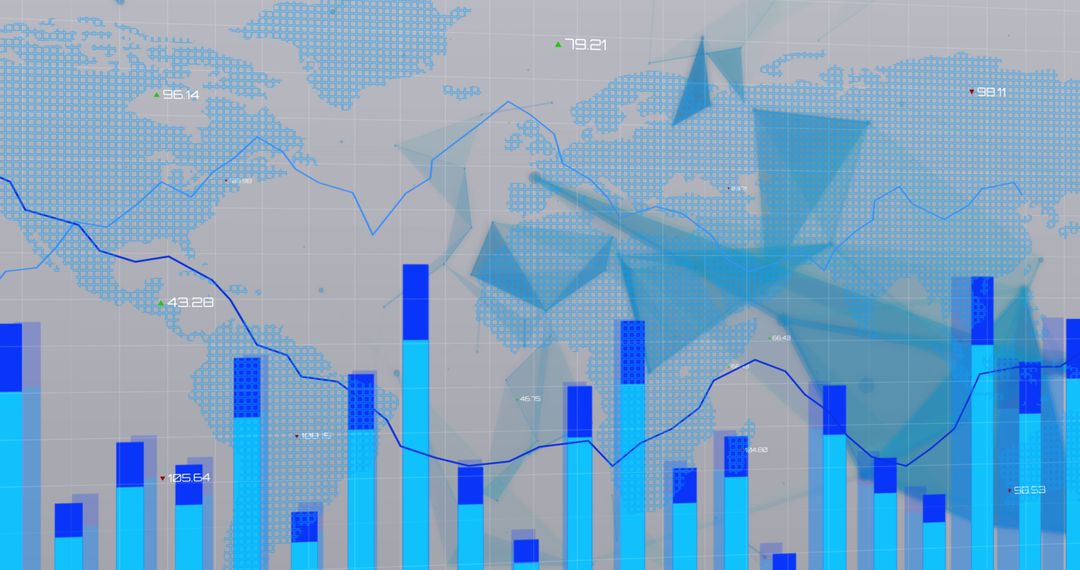
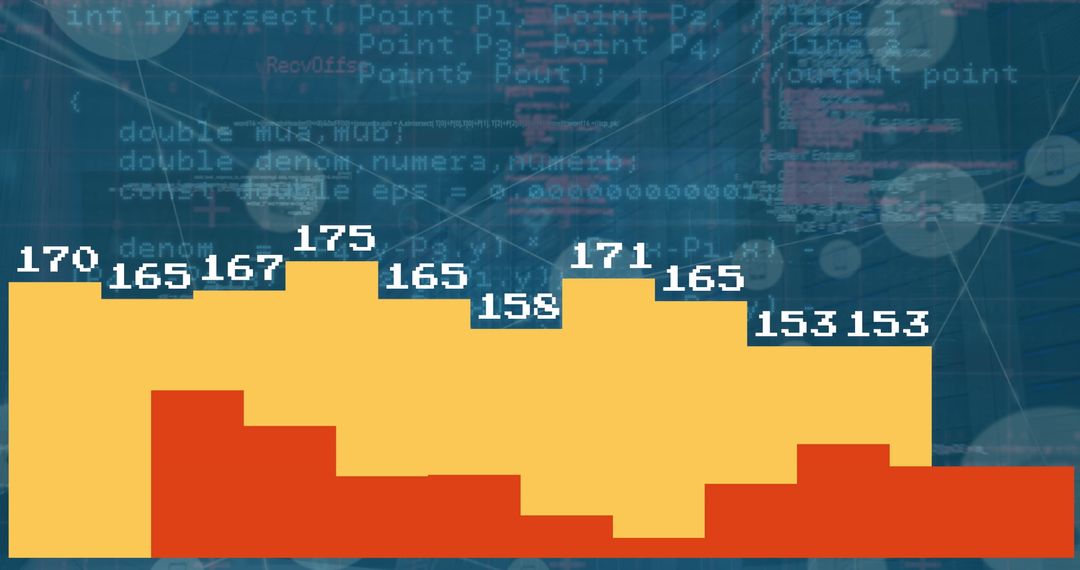
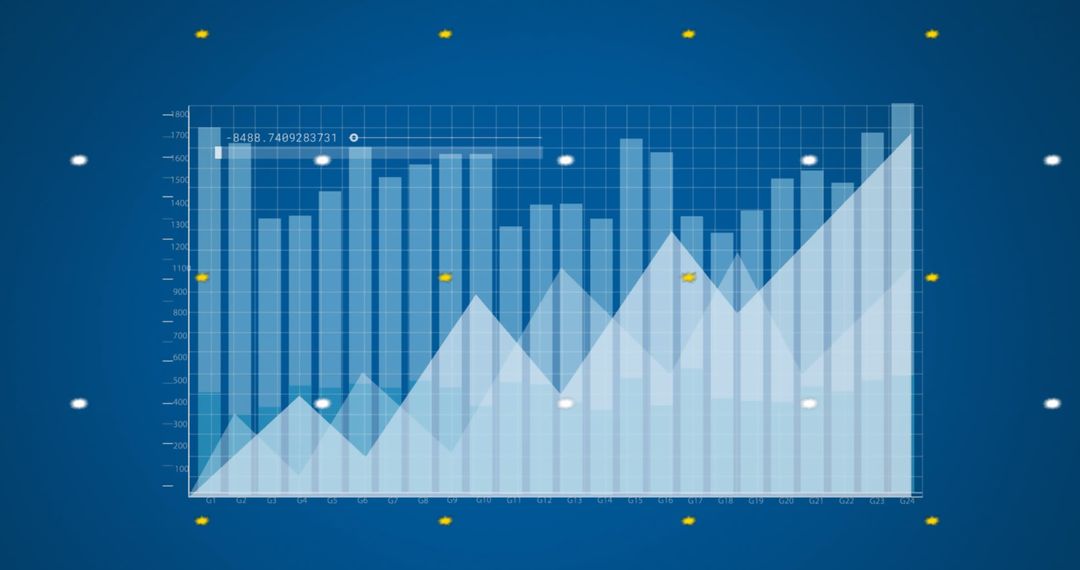
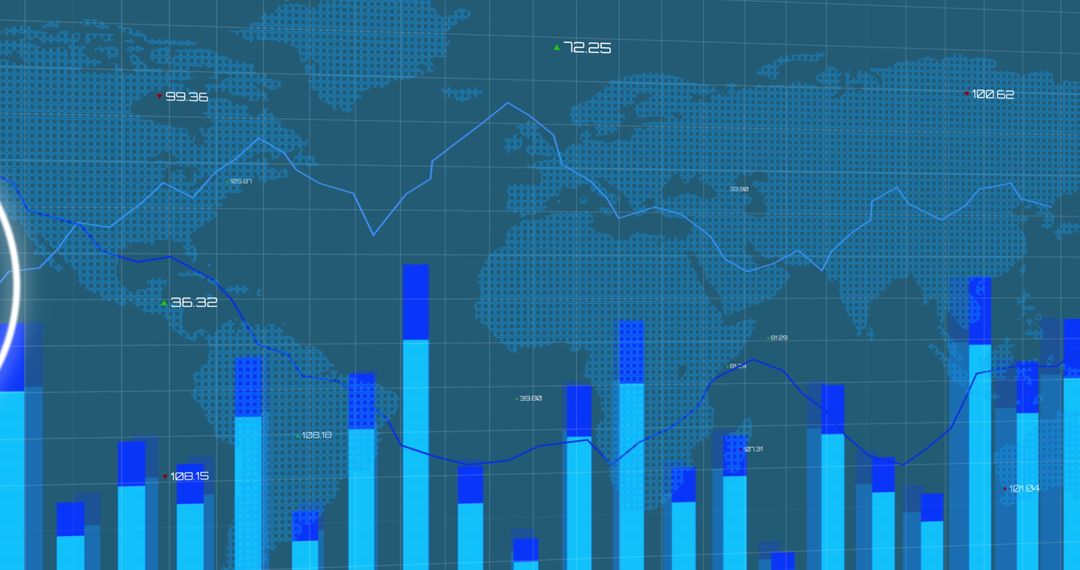
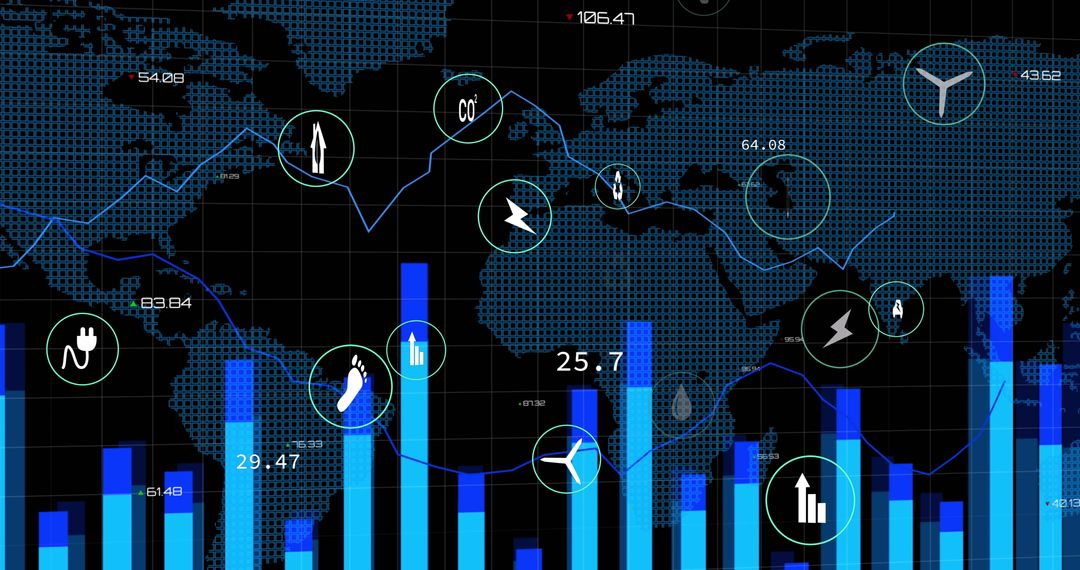
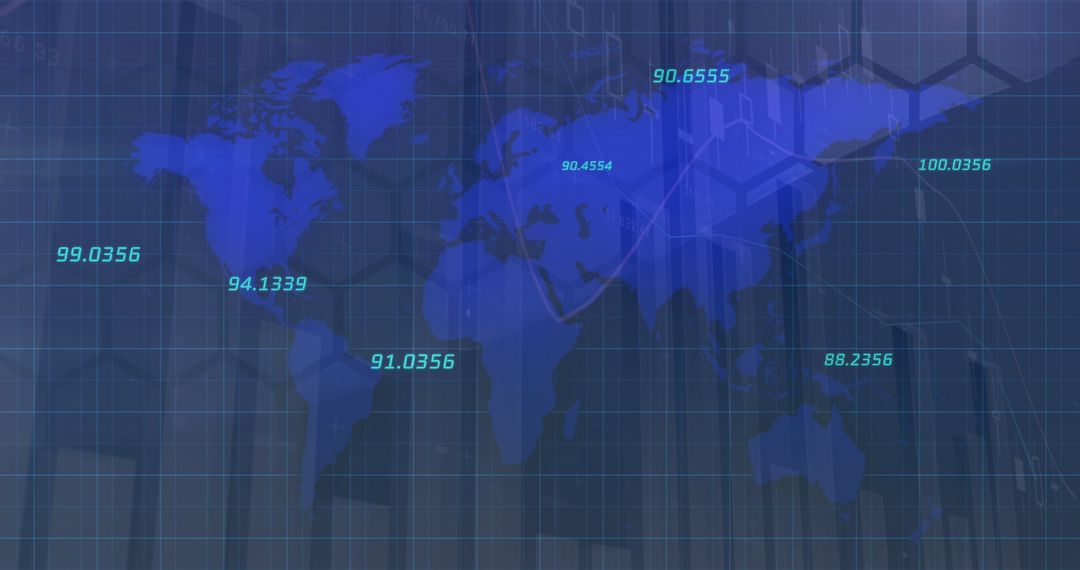
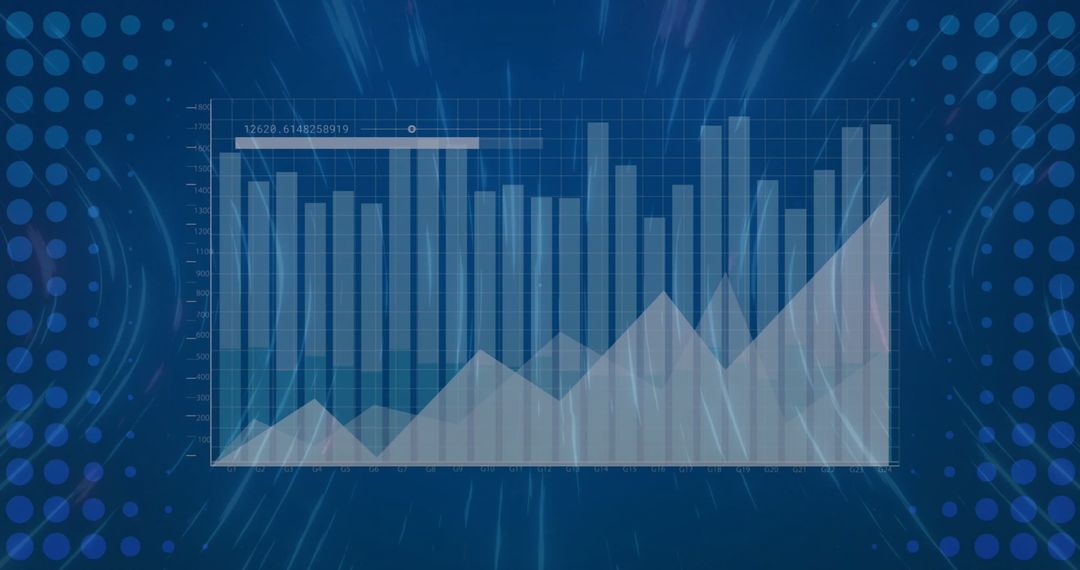
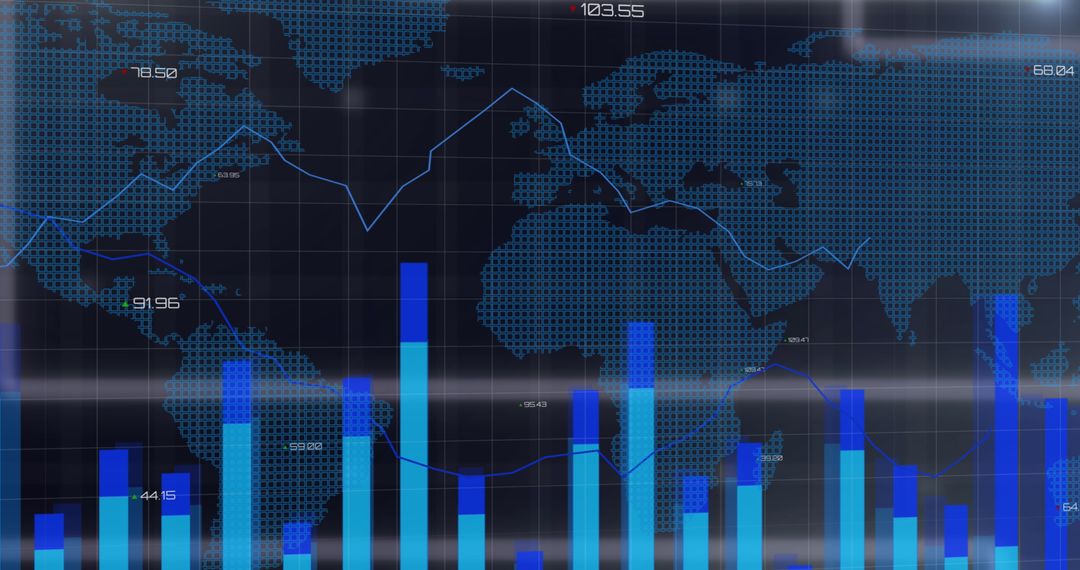
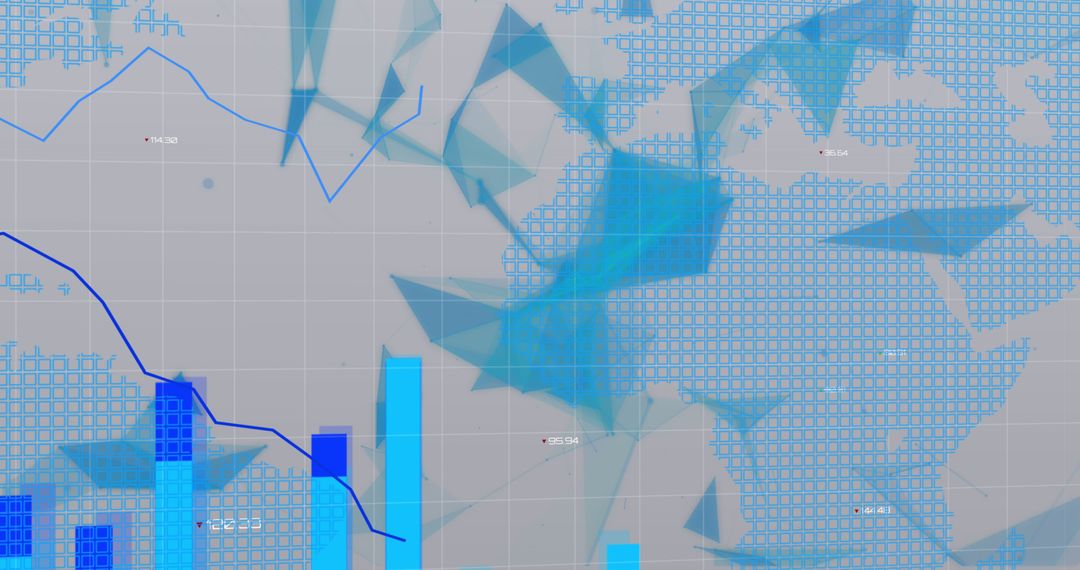
- Digital Infographic with World Map and COVID-19 Data Analytics
Digital Infographic with World Map and COVID-19 Data Analytics Image
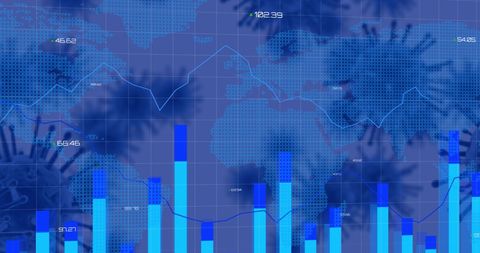
This digital illustration depicts global data analytics with emphasis on the impact of COVID-19, featuring a world map and visual elements like bar graphs and data lines. Ideal for presentations on pandemic data analysis, health statistics research, global health discussions, economic impact studies, and information security strategies.
Powered by  - Get 15% off with code: PIKWIZARD15


2
downloads
downloads
Tags:
More
Credit Photo
If you would like to credit the Photo, here are some ways you can do so
Text Link
photo Link
<span class="text-link">
<span>
<a target="_blank" href=https://pikwizard.com/photo/digital-infographic-with-world-map-and-covid-19-data-analytics/ebc02f5dc98358faa74104782b61a18e/>PikWizard</a>
</span>
</span>
<span class="image-link">
<span
style="margin: 0 0 20px 0; display: inline-block; vertical-align: middle; width: 100%;"
>
<a
target="_blank"
href="https://pikwizard.com/photo/digital-infographic-with-world-map-and-covid-19-data-analytics/ebc02f5dc98358faa74104782b61a18e/"
style="text-decoration: none; font-size: 10px; margin: 0;"
>
<img src="https://pikwizard.com/pw/medium/ebc02f5dc98358faa74104782b61a18e.jpg" style="margin: 0; width: 100%;" alt="" />
<p style="font-size: 12px; margin: 0;">PikWizard</p>
</a>
</span>
</span>
Free (free of charge)
Free for personal and commercial use.
Author: Authentic Images
Similar Free Stock Images
Premium


Premium


Premium


Premium