
- Home >
- Stock Photos >
- Digital Innovation Dashboard with Data Nodes and Analytics Graphics
Digital Innovation Dashboard with Data Nodes and Analytics Graphics Image

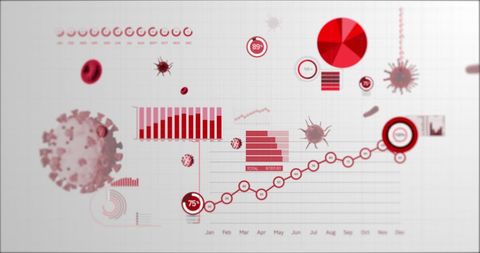
Dashboard showcasing interconnected data nodes and analytics graphics offers a futuristic look at digital technology. Delivery and package icons represent logistics, while bar charts highlight analytical trends. Useful for illustrating topics in digital innovation, data analytics visualization, enterprise technology advancements, and IoT connectivity in logistic solutions.
Powered by 


downloads
Tags:
More
Credit Photo
If you would like to credit the Photo, here are some ways you can do so
Text Link
photo Link
<span class="text-link">
<span>
<a target="_blank" href=https://pikwizard.com/photo/digital-innovation-dashboard-with-data-nodes-and-analytics-graphics/a3a0fb7e825fb16332cc5d9d29d0ebd2/>PikWizard</a>
</span>
</span>
<span class="image-link">
<span
style="margin: 0 0 20px 0; display: inline-block; vertical-align: middle; width: 100%;"
>
<a
target="_blank"
href="https://pikwizard.com/photo/digital-innovation-dashboard-with-data-nodes-and-analytics-graphics/a3a0fb7e825fb16332cc5d9d29d0ebd2/"
style="text-decoration: none; font-size: 10px; margin: 0;"
>
<img src="https://pikwizard.com/pw/medium/a3a0fb7e825fb16332cc5d9d29d0ebd2.jpg" style="margin: 0; width: 100%;" alt="" />
<p style="font-size: 12px; margin: 0;">PikWizard</p>
</a>
</span>
</span>
Free (free of charge)
Free for personal and commercial use.
Author: People Creations
Similar Free Stock Images

Premium


Premium


Premium


Premium


Premium


Premium


Premium


Premium


Premium


Premium


Premium


Premium


Premium

Premium

Premium


Premium


Premium


Premium


Premium


Premium


Premium


Premium


Premium


Premium


Premium


Explore More Free Stock Images