
- Home >
- Stock Photos >
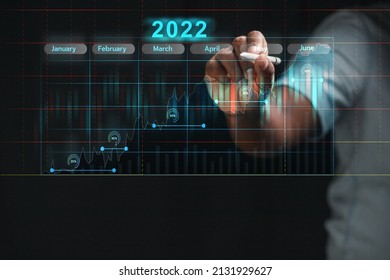
- Digital Interface Conceptualizing Monthly Data Trends
Digital Interface Conceptualizing Monthly Data Trends Image

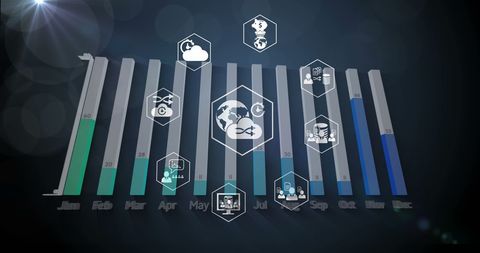
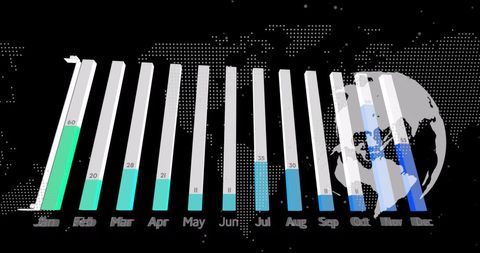
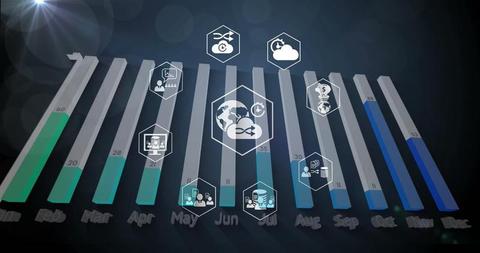
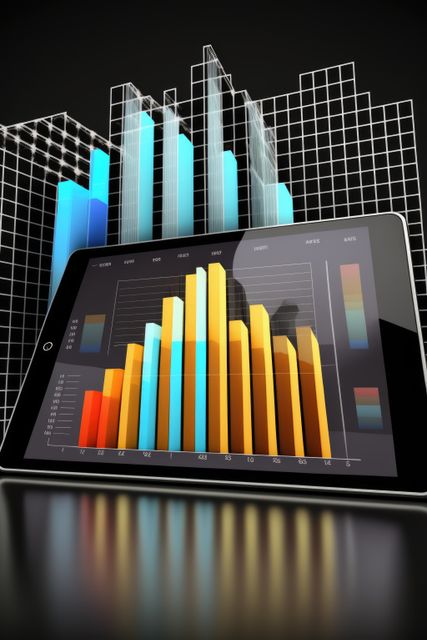
Bar graph represents monthly data trends highlighted above black digital interfaces. Great for illustrating data analytics, futuristic business reports, technological advancements, or digital transformation. Useful in articles or presentations about modern business strategy and technology integration.
Powered by  - Get 15% off with code: PIKWIZARD15


downloads
Tags:
More
Credit Photo
If you would like to credit the Photo, here are some ways you can do so
Text Link
photo Link
<span class="text-link">
<span>
<a target="_blank" href=https://pikwizard.com/photo/digital-interface-conceptualizing-monthly-data-trends/348dbebadad0aae1f81f6edead9d6e86/>PikWizard</a>
</span>
</span>
<span class="image-link">
<span
style="margin: 0 0 20px 0; display: inline-block; vertical-align: middle; width: 100%;"
>
<a
target="_blank"
href="https://pikwizard.com/photo/digital-interface-conceptualizing-monthly-data-trends/348dbebadad0aae1f81f6edead9d6e86/"
style="text-decoration: none; font-size: 10px; margin: 0;"
>
<img src="https://pikwizard.com/pw/medium/348dbebadad0aae1f81f6edead9d6e86.jpg" style="margin: 0; width: 100%;" alt="" />
<p style="font-size: 12px; margin: 0;">PikWizard</p>
</a>
</span>
</span>
Free (free of charge)
Free for personal and commercial use.
Author: People Creations
Similar Free Stock Images
Premium


Premium


Premium

Premium


Premium

Premium

Premium

Premium


Premium


Premium


Premium

Premium


Premium

Premium


Premium

Premium


Premium


Premium


AI


Premium


Premium

Premium

Premium

Premium


Premium


Premium

Explore More Free Stock Images